Place Bears Power on XAUUSD Chart MT4 Software Platform
This learn gold course will illustrate how to place Bears Power Trading Indicator on the Chart on the MT4 Software. For Technical Analysis: Technical Analysis of Bears Power.
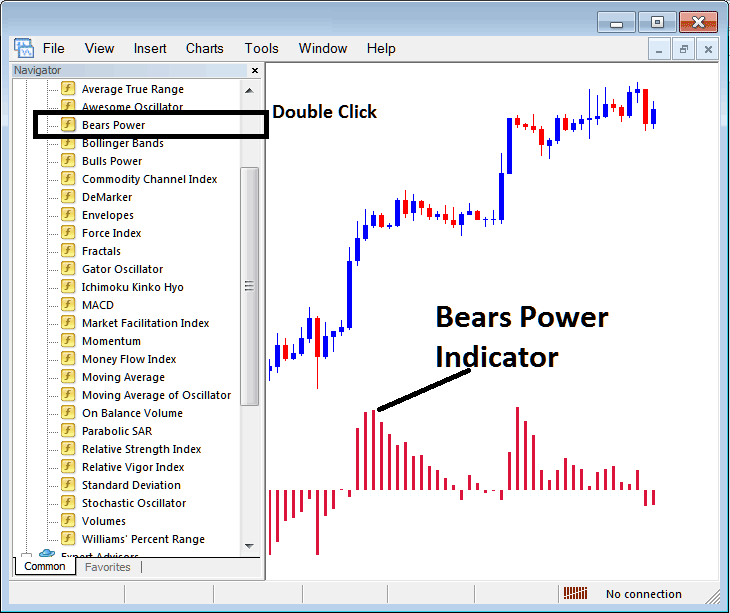
How to Add XAU USD Indicators on MT4 Charts
Step 1: Open The Software Platform Navigator Window Panel
Open the Navigator panel as shown below - go to the "View" menu (then click it) and pick the "Navigator" window panel (click), or from the Standard ToolBar, click the "Navigator" button, or use the shortcut keys "Ctrl+N" on your keyboard.
On the Navigator section, find and pick "Indicators", (Press the button twice)
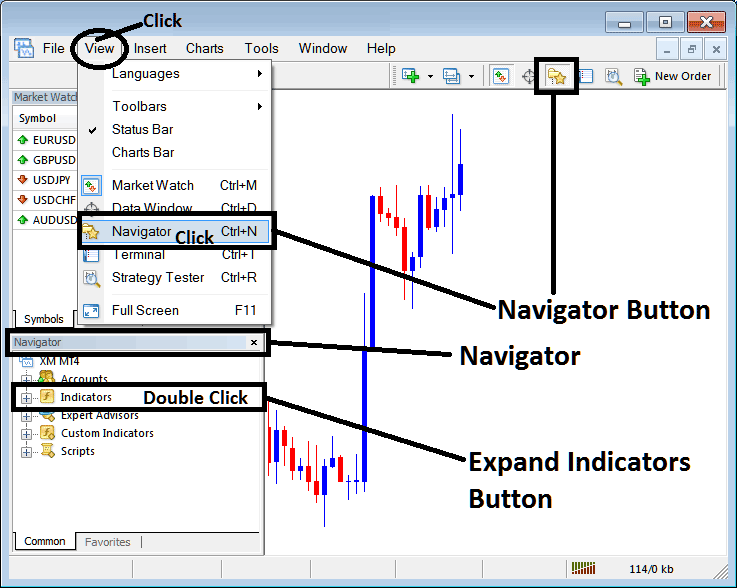
Step 2: Expand the Technical Indicator Menu on the Navigator
Make the technical indicator menu bigger by selecting the spread symbol button named ' + ' or click twice on the "indicators" menu, and after that, this symbol will then be seen as (-) & will then show up as a list as shown below.
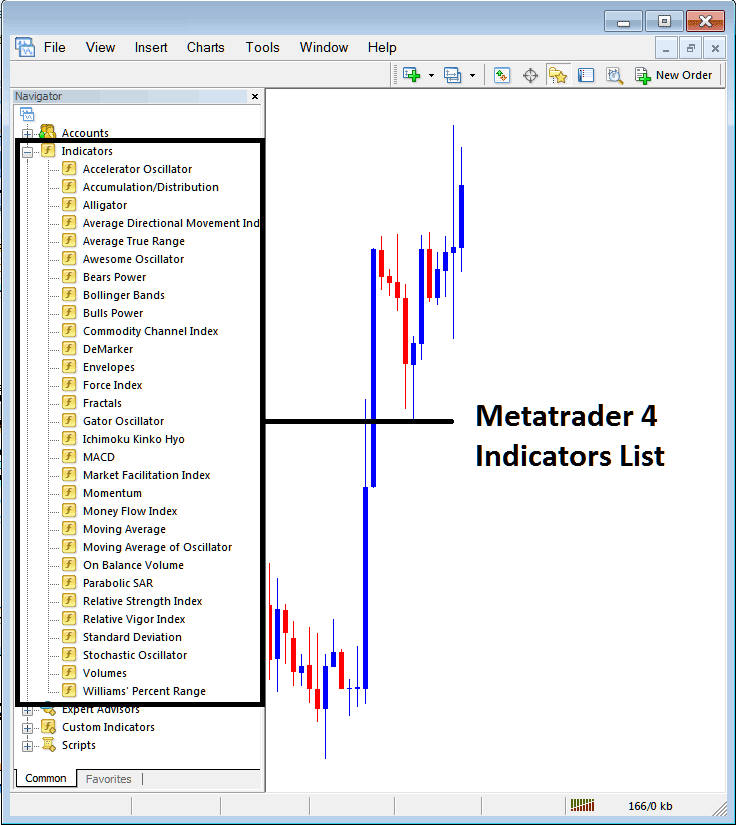
In the previously shown panel, any indicator preferred by the trader can be integrated into the chart.
Placing Bears Power Trading Indicator on Chart
Step 1: Pick or choose the Bears Power button from the MetaTrader 4 list of tools as shown below:
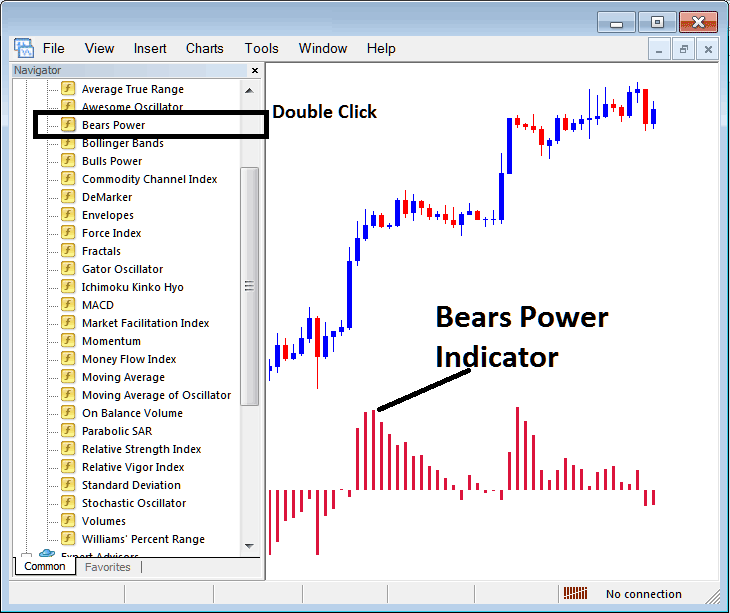
Step 2: Double-click the Bears Power button and click OK. It adds the indicator to the chart below.

Edit Indicator Settings
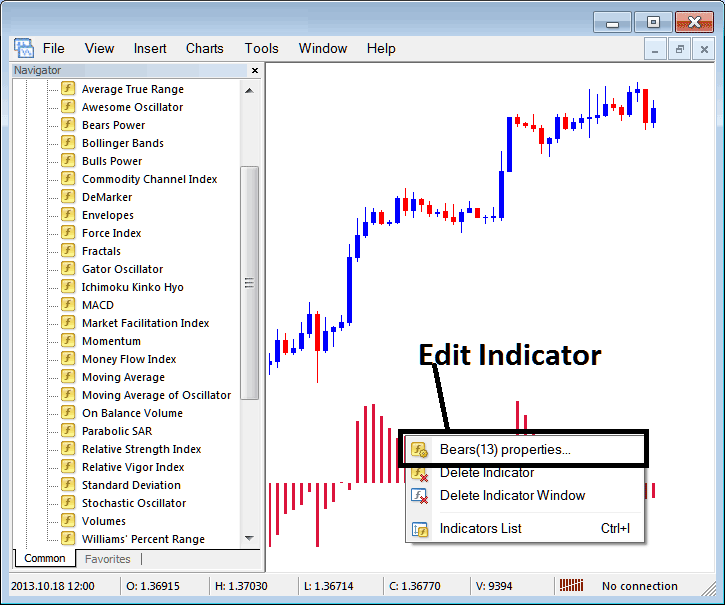
To change settings, right-click the Trading Indicator. Select properties, edit in the menu, and click okay once adjusted.
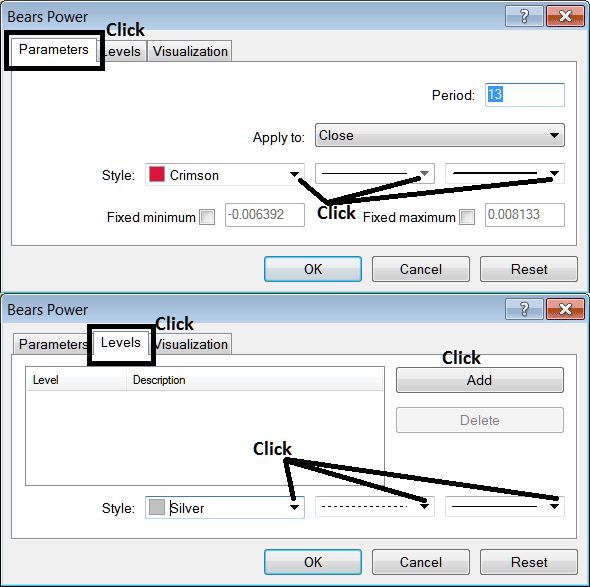
The following small window comes up, and the Bears Power qualities can be changed and fixed from this small window panel.
More Courses & Tutorials:
- XAU/USD Market Hours
- How many XAUUSD patterns get used in XAU USD trading?
- XAUUSD Trend-lines for Intraday XAUUSD
- Free XAUUSD Indicators Described
- Drawing Fibonacci Extension Levels on Upward and Downward XAUUSD Trends
- What is a Nano Lot in XAUUSD for Nano XAU/USD Account?
- How to Analyze/Interpret Fibonacci Pullback Levels & Fibonacci Extension Levels in Gold Trading
- How to Set MACD Indicator on Gold Chart in MT4 Platform Software
- What is the Interpretation of Charts?

