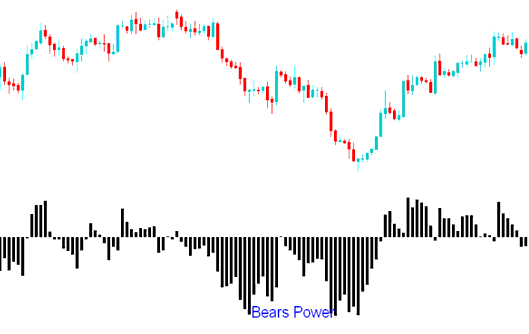
Bears Power Analysis & Bears Power Trade Signals
Created by Alexander Elder
Bears Power is used to see how strong the Bears (Sellers) are. Bears Power shows the balance of power between those buying and selling.
This tool is intended to ascertain whether a downward trend is set to endure or if the price has reached a point conducive to a reversal.
Calculation
A price bar consists of four components: the Opening, Closing, High, and Low prices.
Each Price bar either closes higher or lower than the prior price bar.
The highest trading price reveals the maximum strength of the buyers (bulls) during that price interval.
The lowest trading price indicates the highest strength of the Bears (Sellers) during that price timeline.
This technical indicator employs the Low price and a Moving Average (Exponential Moving Average).
The moving average effectively establishes the midpoint equilibrium between sellers and buyers across a defined span of price movement.
Therefore:
Bears Power equals Low Price minus EMA

XAU/USD Analysis & How to Generate Trading Signals
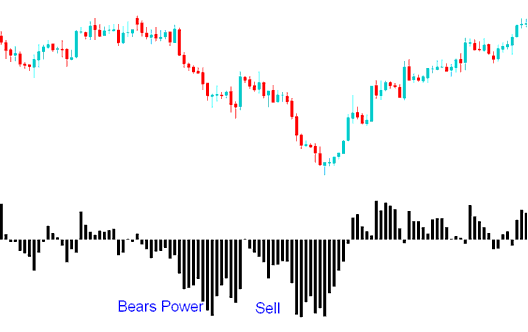
Sell Trading Signal
A sell signal is generated when the oscillator crosses below Zero.
The technical indicator is below zero, and the Oscillator Technical is below the zero point since the LOW is lower than the Exponential Moving Average in a downturn.

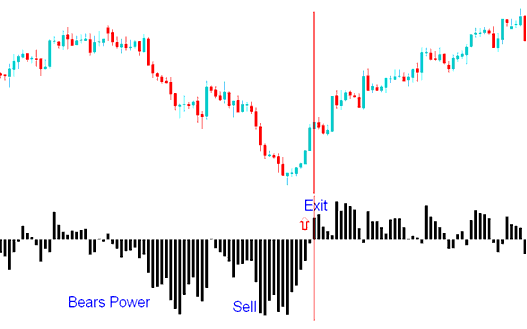
Exit Signal
If the LOW goes higher than the Exponential Moving Average, it means prices are starting to go up, and the histogram goes above zero.

The Triple Screen protocol utilizes price trend identification on a broader chart interval (e.g., the daily timeframe) and applies bearish momentum signals exclusively on a more granular chart interval (e.g., the hourly timeframe). Trading decisions are executed based on the signals from the lower timeframe, strictly adhering to the overarching direction indicated by the long-term trend observed on the higher timeframe chart.
Get More Courses:
- How Do I Place Fibonacci Extension Levels in MT4 Platform Software?
- Recursive Moving Trend Average XAU USD Indicator
- MACD XAU/USD Indicator Analysis Strategies
- XAU USD MT4 Drawing Gold Trend-line Tools
- Analysis of CCI XAU/USD Indicator Divergence XAU USD Setups
- Bollinger Bands XAUUSD Price Action on Upwards XAUUSD Trend and Downwards XAUUSD Trend
- MT4 William Percentage R XAU/USD Indicator Analysis
