Bilateral/Consolidation Patterns Gold Trading
Bilateral or consolidation patterns mean the market could go either way. Charts form two main types of these patterns.
- Symmetric Triangles - Consolidation Patterns
- Rectangles - Range market
Consolidation Patterns
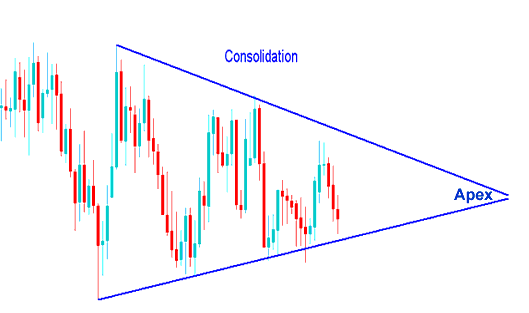
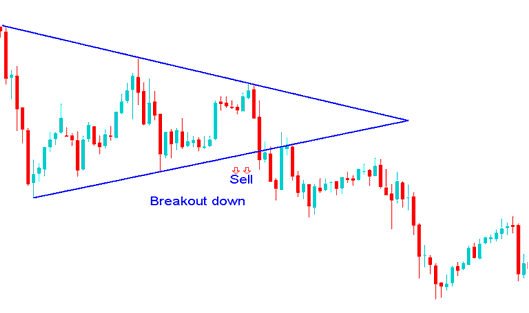
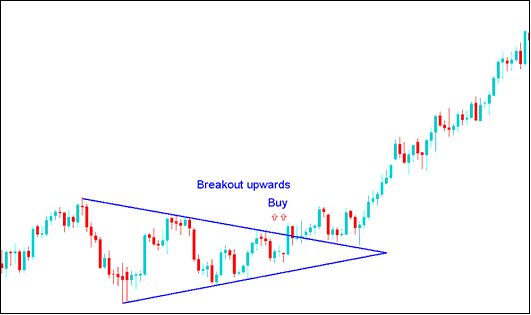
Symmetric triangles form with lines that meet, creating a pause in action. An upside break signals a buy. A downside break means sell. Markets often break out before the pattern's tip.
Trend Lines are created by linking together the lowest and highest points during a period of balance, and the trendlines made are matching and come together to make a point. A price move out of the pattern should occur between 60% and 80% inside the triangle-shaped chart. A move out that happens too soon or too late is more likely to fail and, therefore, is less dependable. After a price move out, the point becomes levels of support and resistance for the price. The price that has moved out of the balanced chart setup should not go back past the point level. The point level is used as an area to set stop loss orders for the currently active trades.
When we see these kinds of chart patterns that show things are steady, it means the market is pausing to figure out where to go next.
These consolidation chart patterns form when there's a tug of war between the buyers and the sellers & the market can't decide which side to move.

Consolidation Pattern
This chart pattern won't last forever. Like a tug-of-war, one side wins in the end. Look at the chart below. The range breaks out and heads one way. As traders, how do we pick the winning side?

Breakout Downwards Sell Trade Signal after a Consolidation Pattern

Break Out Upwards Buy Trade Signal after a Consolidation Pattern
Now back to our question, how do we make sure we're on side that is winning?
Well we wait til price goes past one of the lines & put buy or sell orders in that particular direction. After consolidating, If the price breaks-out the upper line we buy, if it breaks-out out the lower line we sell.
Alternatively, if you prefer not to wait for the consolidation pattern, you, as a xauusd trader, can employ pending orders. To gain further insights into pending orders, please refer to the lesson: Stop Entry Order Types.
The two kinds of stop orders used in trading consolidation patterns include:
- Buy Entry Stop An order to open buy at a level above market price.
- Sell Entry Stop An order to sell at a level below market price.
These are orders to open buy above the market or to open sell below the market.
Rectangle Trade Pattern
A rectangle consolidation chart pattern is a range showing a small price change that causes a break in the market. The price range has 2 trendlines that are next to each other, are flat, and show where the price finds support and meets resistance. This pattern is marked on a chart using a rectangle, which is why it is called a rectangle chart pattern.
For this consolidation pattern, xauusd price forms multiple highs & lows which can be linked with horizontal trend lines that are parallel to each other. This pattern occurs over an extended period of time, giving the chart pattern setup formation its rectangle shape.
A price breakout from this consolidation chart pattern is confirmed when either of the horizontal boundaries is breached, thereby breaking the established price range of the rectangle. An upward breakout serves as a buy signal, while a downward breakout confirms a sell signal.

Rectangle Pattern XAUUSD - Consolidation Pattern
Price Breaks the consolidation trading range after sometime & continues to move upward after an up-wardsupward market break out.
Learn More Lessons & Courses:
- Day Trading Strategies Lesson
- Gold Practice Trading on MT4 Practice Account
- MetaTrader 4 Copy Platform & MetaTrader 5 Copy Software
- How Do You Spot a XAU/USD Rectangle Shape Forming in Gold Trading?
- Instructions to Download MT5 Gold Software on iPad
- A list of recommended technical indicators for gold (XAUUSD) traders to consider.
