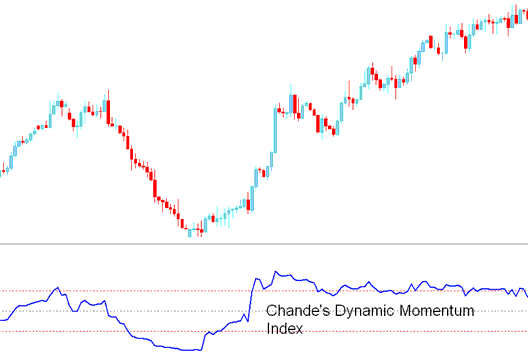
Chande Dynamic Momentum Index for Gold and Signals
Created by Tushar Chandes
The Chandes DMI indicator is like Welles Wilder's Relative Strength Index technical indicator, but there is one very important difference.
RSI sticks to a set number of price periods. The Chande Momentum Dynamic Index adjusts periods based on volatility.
The No. of price bars periods used by the Momentum Index technical indicator decreases as the price volatility increases. This allows the technical indicator to be more responsive to the price changes.
Chandes DMI beats RSI for accuracy, cuts fake signals, and smooths chop.

Gold Analysis and Generating Signals
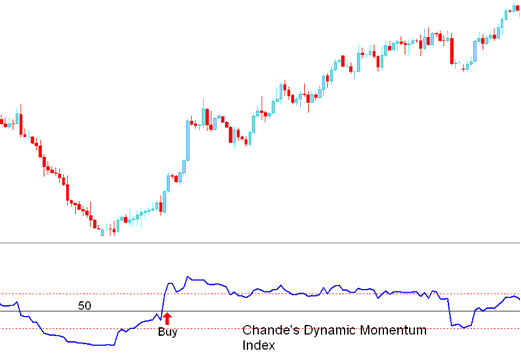
Buy Signal
A buy signal gets generated when DMI crosses above the 50 level mark.

Buy Signal
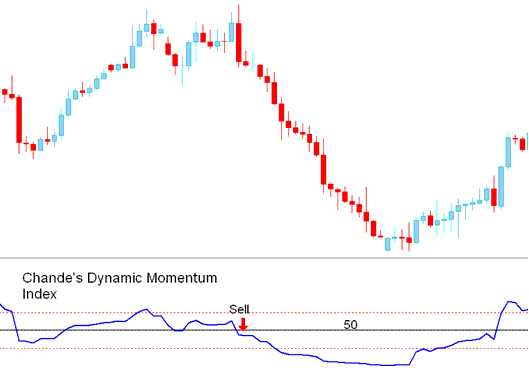
Sell Trading Signal
A sell trading signal gets generated when DMI crosses below the 50 level mark.

Sell Signal
Learn More Topics and Courses:
- How to Draw a Downward Channel?
- Creating Fibonacci Expansion lines on Rising and Falling Movements
- Analysis Chandes Dynamic Momentum Index Trading Indicator Buy and Sell Signal
- Setting Up Gold Indicators on MT4 Gold Charts
- Fibonacci Expansion Levels on Gold Charts: How to Show Fibonacci Expansion On XAUUSD Trends

