How Do I Interpret Coppock Curve Buy Signal and Sell Signal?
Coppock Curve How to Interpret/Analyze Technical Indicator Buy Signal
Interpreting a Buy Trade Signal Confirmation Using the Coppock Curve Indicator
Procedures for Analyzing and Understanding Buy Signals Utilizing the Coppock Curve Indicator:
This lesson on the Coppock Curve indicator's buy signal offers insights into how to analyze and interpret buy signals using the Coppock Curve indicator, as illustrated below:
How Do I Interpret Buy Signals Using the Coppock Curve Indicator
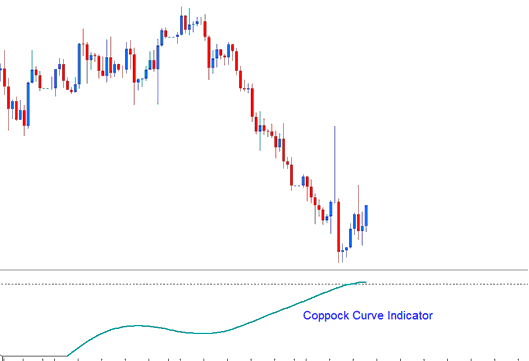
Coppock Curve How to Interpret/Analyze Trading Indicator Sell Signal
How do you interpret a sell signal using the Coppock Curve Indicator?
A Structured Approach to Analyzing and Interpreting Sell Signals Based on the Coppock Curve Indicator:
This lesson on the **Coppock Curve indicator sell signal** provides a clear explanation of how to analyze and interpret sell trading signals generated by this indicator, as demonstrated and displayed in the accompanying illustration:
How Do I Interpret Sell Signals Using the Coppock Curve Technical Indicator
Coppock Curve indicator was used for technical analysis in forex.
The Coppock Curve indicator relies on trading psychology, based on the idea that human behavior is predictable, resulting in a price movement that fluctuates in a zigzag manner.
The principle of adaptation levels explains how prices behave at particular levels, with markets behaving in the same manner or following the same pattern as historically observed.
How Do I Interpret Coppock Curve Buy & Sell Signals?
In trading, The Moving Average is the simplest form of an adaptation levels - the price will oscillate around the MA Moving Average. This forms the basis of this Coppock Curve indicator, which is a longer-term oscillator trading based on this adaptation levels - moving average, but in a different way.
Oscillators often start by figuring the percent change in the main market price from an earlier price. That earlier price acts as the base point, like adaptation levels.
Edwin Coppock believed that you could roughly measure traders' feelings when trading by adding up the percentage changes in price over a short period to understand the market's general direction over a longer period.
For example, if we evaluate prices from a week ago and find that today the market is up by 20%, compared to a rise of 15% the previous day, and increases of 10%, 7.5%, and 5% respectively in the days preceding, we can conclude that prices are gaining momentum.
You can use basic signals from the Coppock Curve to trade price turns at extreme levels. Pair trend line breaks with the Coppock Curve. This confirms signals from the indicator.
How Do You Analyze Coppock Curve Indicator?
Get More Courses & Guides:
- Techniques for Forecasting Trend Reversals Based on XAU USD Candle Formations.
- How to Register for a Live Trading Account for XAU/USD
- Guide on Placing XAU/USD Orders Directly on MetaTrader 4 Charts
- How Can You Change a Stop Loss XAU USD Order in Gold MetaTrader 5 System?
- How do I register for a demo account?
- App for Beginners Trading XAU/USD

