RSI Gold Indicator Overbought and Oversold Levels
The 1-hour and 15-minute charts both use 100 and 200 SMA. These simple moving averages help spot the market price trend direction.
RSI under 30 signals oversold conditions. Traders see it as a bottom to take profits.
For gold trading, always confirm those overbought and oversold levels with an RSI center line crossover. If you spot a market top or bottom in those regions, back it up with the RSI signal - because without it, these zones are notorious for fake outs.
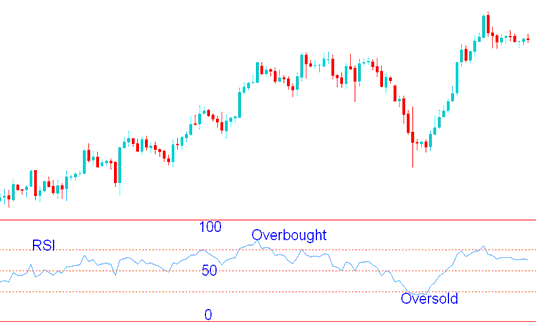
As illustrated below, when the RSI reaches 70, it signals an overbought condition. This reading is often interpreted as a potential trigger for trend reversal.
The chart soon flipped its trend and dropped. It hit oversold levels, marking a bottom. Then prices climbed back up.

Over-bought & Oversold Levels - RSI Gold Methods
Over Extended Overbought & Oversold Levels
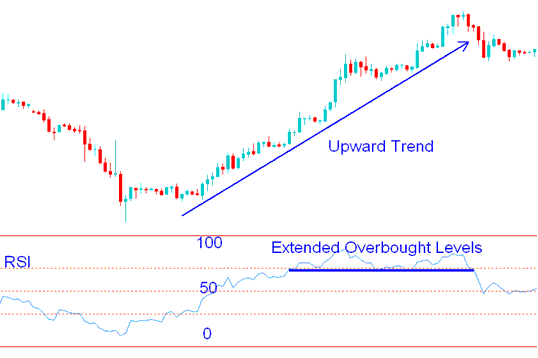
When the market's price goes up or down a lot, the RSI will stay at very high or very low levels for a while. If this happens, you can't use these high and low levels to find the highest and lowest gold prices because the RSI will stay at those levels for a long time. This is why we say that the high and low levels can trick you, so it's better to check these trading signals by using the RSI center line strategy method.

RSI Gold Strategy for Overbought and Oversold Zones
More Subjects and Online Classes:

