
Reversal Chart Setups Head and Shoulders and Reverse/Inverse Head and Shoulders
Head and Shoulders Reversal Chart Setup
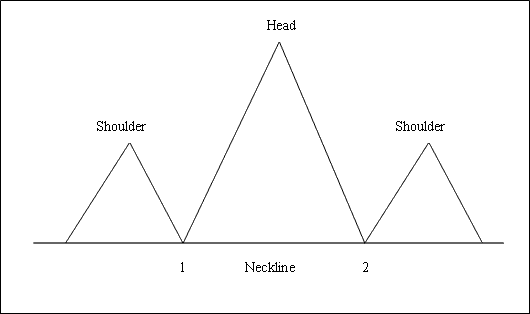
This reversal pattern forms after a long gold price rise. It includes three peaks: left shoulder, head, and right shoulder, with two dips between them.
The head and shoulders pattern ends when price breaks below the neckline. Draw the neckline by linking the two lows between the shoulders.
To go short, Gold traders place their sell stop orders just below the neckline.
Conclusion: This specific chart formation indicating a reversal occurs subsequent to a prolonged upward price movement.
This specific configuration suggests an impending shift in market direction.
This formation resembles head with shoulders thus its name.
To draw the neckline, we connect points 1 and 2 as shown below, and then we extend that line in both directions.
We sell when price breaks below the neckline: see the chart below for explanation.
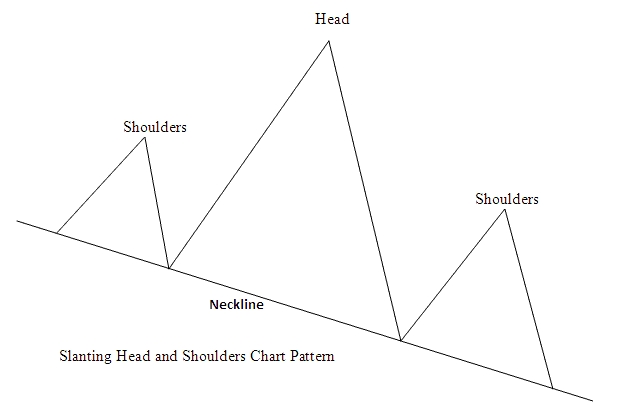
A head and shoulders pattern can also develop along a sloping neckline, as illustrated in the example below:
Example of Head Shoulders Setup on a Gold Price Chart
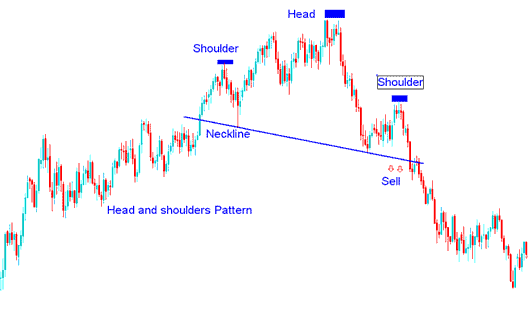
Head & Shoulders Chart Pattern
This reversal pattern can also be formed on a sloping neckline, like the one above, the neckline does not have to be necessarily horizontal.
Reverse Head & Shoulders Reversal Chart Setup
Look at the example below with trend-lines A, B, and C. They show how setups build stronger trends as momentum grows.
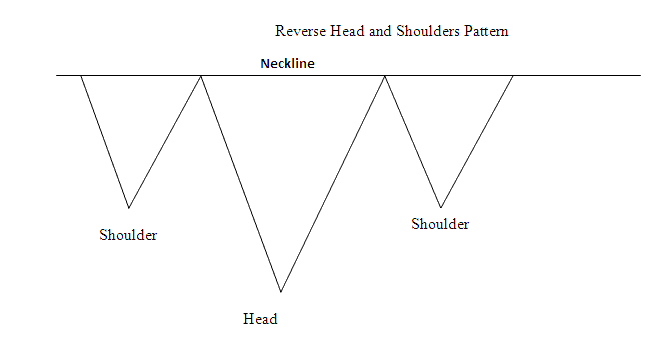
The Head and Shoulders Reversal pattern finishes when price breaks above the neckline. Connect the two peaks to draw it.
To go long buyers place their buy stop orders just above the neckline.
Summary:This reversal pattern forms after an extended move downwards
This specific configuration suggests an impending shift in market direction.
This particular configuration bears a resemblance to an inverted head and shoulders pattern, hence its designation as 'Reverse'.
Buy when price crosses above the neckline, as shown in the chart.
Illustrative Case: Setting Up an Inverse Head & Shoulders Pattern Observation on Gold Pricing
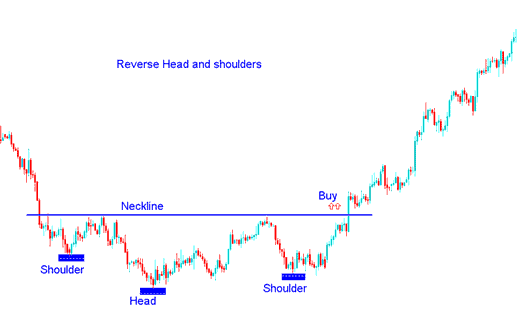
Reverse Head & Shoulders Chart Pattern
Access More Tutorials and Guides
- XAUUSD Define a Gold Trend Reversal on XAU/USD Charts
- Which Gold Broker is Best for Opening Cent Account?
- DeMarks range extension indicator for signaling buy and sell actions in stock indices.
- Trading XAU/USD Using Gold Candle Patterns
- Tutorial of How to Hide Symbols/Quotes on the MT4 Trade Software/Platform
- XAUUSD Orders
- MetaTrader 4 Tutorial Lesson XAU USD Chart Analysis