Trading XAUUSD Using Pivots Points
Pivot Points is a set of indicators that were developed by floor traders trading the commodity markets so that to help them identify the potential market reversal points. These turning points were referred to as pivots. These pivot point levels are calculated in order and so as to determine the levels at which the market sentiment of current market trend could change from bullish to bearish or vice versa.
Gold traders use the points as markers of support & resistance areas.
Pivot Point Calculations: Derived as the mean of high, low, and close data from the previous trading market session:
Pivots Points = (High + Low + Close) / 3
Day traders utilize calculated pivot point levels to determine entry points, establish stop-loss levels, and set take profit orders. Pivot points aim to identify where most traders are placing their orders simultaneously - in other words, when numerous traders act in the same manner.
In technical analysis, a pivot point level is a significant financial trading market indicator that's used by the traders to predict the price movement. This gold indicator is calculated as an average/mean of the significant prices (high, low & close) from the performance of market prices in the previous trading period.
Bullish Sentiment - If prices in the following period trade above the central pivot point: this is evaluated as a bullish sentimentBearish Sentiment - If prices in the following period trade below the center pivot point: this is interpreted as a bearish sentiment
The center pivot point is also used to calculate additional levels of support & resistance, below and above this central pivot point, respectively - by either adding or subtracting the price differentials calculated using the previous trading data.
A Pivot Point, along with its corresponding support and resistance thresholds, frequently serves as a fulcrum for price movement direction changes.
In an uptrend, price holds above the pivot point. Resistance levels act as a cap. If price breaks above, the uptrend may fade. A pullback could follow.
In a downtrend, price remains under the pivot point. Support levels serve as a floor for price. If price drops below them, the downtrend stops. A rally or pullback may start.
The Central Pivot Point is used to calculate the support & resistance areas as follows:
Pivot points are composed of a central point level, flanked by three support levels beneath and three resistance levels above. These pivot points were initially utilized by floor traders in equities and futures exchange markets, primarily because they offered a swift method for traders to gauge market movement throughout the trading day using only a few straightforward calculations. Over time, these pivot point levels have also demonstrated significant utility in various other trading markets.
One of the reasons why these pivot points are so common now is that they are seen as a "leading" (or forecasting) indicator instead of one that follows behind.
Pivot points for today use yesterday's high, low, and close. This indicator's 24-hour levels follow these simple formulas:
The central pivot point can then be utilized to establish three support and three resistance levels as outlined:
Resistance 3, Resistance 2, Resistance 1, Pivot Point, Support 1, Support 2, Support 3
The Pivot Points indicator is illustrated below:
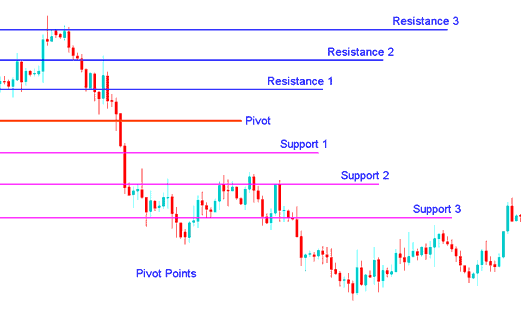
XAUUSD Trading Using Pivots Points
Pivot Points Technical Analysis
The central pivot point level serves as either the strongest resistance or support zone, depending on overall market sentiment. In a range-bound or directionless market, prices often fluctuate near this level until a significant breakout occurs.
Prices over the pivot point signal bullish mood. Below it means bearish. This pivot tool leads and hints at new highs or lows in the time frame.
The support & resistance levels are used as exit points - e.g., if the price is trending upward and prices are above the central pivot, then prices continue to move up to the first and then the second resistance area - then traders can use the second resistance level as a good place to close their buy trade position, as the probability of resistance & reversal increases greatly/substantially with every resistance level.
Pivot point analysis uses three common levels above and below the main pivot. These come from the prior period's price range. Add them to the pivot for resistance, subtract for support.
Pivot Points trading analysis is used in 3 ways:
Trend Direction: The central pivot point helps spot the overall gold price trend. Open trades only with the trend. Buy if gold sits above the pivot. Sell if it falls below.
Price Breakout: In the context of a price breakout, a bullish indication occurs when prices breach upwards past the central pivot point or surpass one of the established resistance zones (typically Resistance 1). Conversely, a sell signal materializes when the price drops below the central pivot point or penetrates one of the support zones (commonly Support 1).
Trend Reversals: When a trend changes direction, a signal to buy happens when the price gets near a support level, like Support 2 or Support 3. The price of gold either touches this level or goes slightly past it, then turns around and starts moving the opposite way.
A sell signal is generated when the XAU/USD price moves toward a resistance zone, such as Resistance 2 or Resistance 3. This occurs when the price touches or slightly breaches the resistance level before reversing direction.
Additional Instructional Material, Directions, and Instruction Sets:
- How Many Tops Draw a Downwards XAU USD Trend-line?
- Accessing and Viewing Candlestick Charts via the Charts Menu in MetaTrader 4
- Placing Gann Lines on XAUUSD Charts on MT4 Platform Software
- Load Gold Chart Templates on MT4
- XAUUSD Support and Resistance for XAU/USD
