Accumulation/Distribution Technical Analysis & Accumulation/Distribution Trading Signals
Developed and Created by Marc Chaikins
This indicator is utilized to evaluate the cumulative flow of money into and out of indices.
Originally used for stock trading, when it comes to stocks "volume" is the number and amount of shares traded for a specific stock, this volume is a direct reflection of the money that's coming into and out of a stock.
The main idea of AD is that how much is being traded (or the flow of money) helps predict where the price will go. (Trading comes before price).
Tick volume shows how much the price changes (ticks) that a broker gets within a specific amount of time. Many brokers use tick volume in the software they use for charting.
Interpretation
This volume indicator serves to assess whether volume is increasing or decreasing as the market price on a chart rises or falls.
Up Index Trend
If prices rise on a chart, the Accumulation Distribution line should also go up. This means volume backs the price move. The upward trend has real power and can last.
If price moves up but volume doesn't follow, the momentum's fading. This sets up divergence between price and indicator, warning you that a reversal could be on the way.
Down Indices Trend
If the price on a trading chart is going down, then the AD tool should also be going down. This shows that the price drop is supported by the amount of trading and that the drop has power behind it.
But if the price goes down but the trading amounts don't, the power behind the move is getting weaker: this makes a difference between the price and AD and suggests the market might move the other way.
Technical Analysis and How to Generate Trading Signals
Shown Below is an example of a chart and the technical analysis explanation
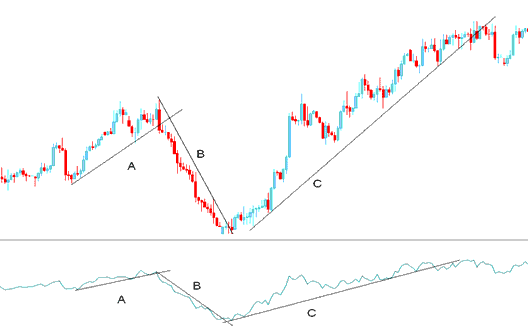
From the chart above, we can divide the trading chart into three segments: part A, part B, and part C.
A - Upwards trend line on chart & also on the Accumulation/Distribution
B - Downward trend-line on chart & also on the Accumulation/Distribution
C - Upwards trend-line on chart & also on the Accumulation Distribution
As long as the price & the indicator are moving in the same direction then the market price move has enough energy to continue moving in that specific direction such as shown above
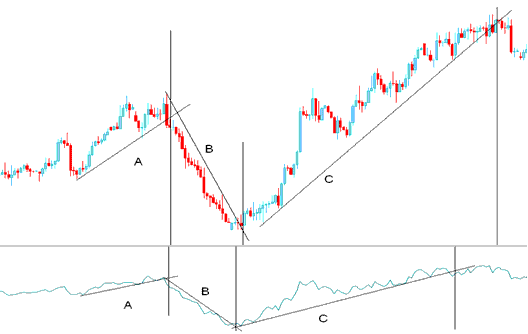
Trendline Break
Looking at the chart above, we can see that when the trend line on the AD indicator broke, the price trend line also broke.
On the chart below, vertical lines mark breaks in trendlines. They show on both price and indicator.
Comparing the trend lines on the indicator and the price those of the AD indicator were broken before those of the chart. This is because the volume always precede the price.
Signals
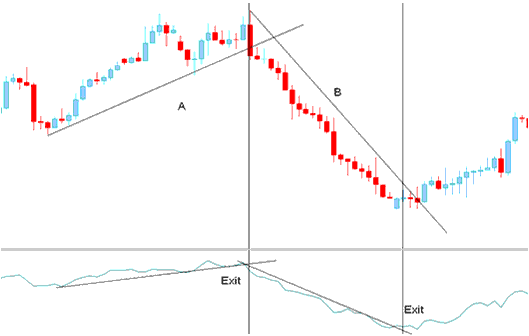
Exit
Exit signals are triggered once the trend line drawn on the Accumulation Distribution indicator is breached. A break in the indicator's trend line suggests a potential shift in market direction is imminent.
Entry
When the trendline on the AD indicator is breached, it indicates a potential reversal in the price direction.
But, if we want to trade in the opposite direction, it's always best to wait for a trading signal that confirms our decision.
A confirmation signal is deemed complete once both the indicator and the price have successfully broken beyond their respective trend-lines.
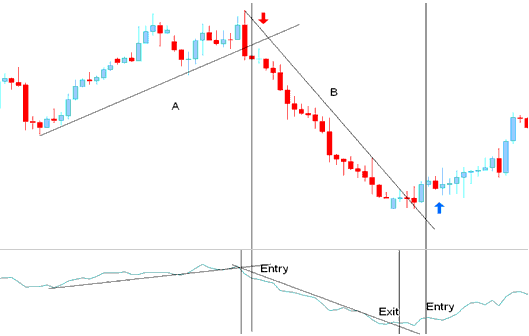
Entry Trading Signal Derived and Generated by Trend Reversal
Get More Lessons:
- Index Trade JP225 in FX
- Study How to Trade NKY225 Index Guide Tutorial
- How Do You Analyze Fibonacci Extension Levels on Index Charts?
- How to Improve Indices Results Using Indices Psychology Guidelines
- How Can I Trade US 100 Indices Strategy?
- How to Use Bollinger Bands Indicator Illustrated
- Best Method to Trade IT 40 Lesson
- TSI Index Indicator Analysis
- HK 50 Trading Strategies How to Make Stock Index Strategy for HK 50 Lesson Guide
- Chaikins Money Flow Index Indicator Analysis on Stock Index Charts
