Chandes Momentum Oscillator Technical Indicator Analysis & Trading Signals
Developed and Created by Tushar Chande
Chandes Momentum Oscillator Indicator measures momentum of indices.
This specific indicator operates within a scale spanning from +100 down to -100, enabling the market participant to clearly observe shifts in net momentum, using the Zero level as the point of equilibrium.
Calculation
The Chandes momentum uses data for days when prices went up and down in the numerator, so it measures momentum directly.
The calculations are performed and carried out on un-smoothed data. This allows for shortterm extreme market moves to be less hidden. However, smoothing out can still be applied to the Oscillator Indicator.
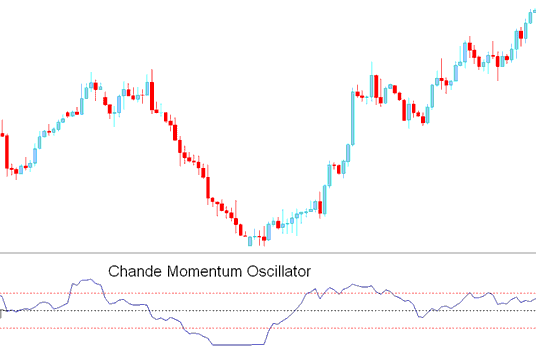
Stock Technical Analysis and How to Generate Trading Signals
Buy Signal
This Oscillator Indicator measures the energy of price.
Levels above Zero line are considered to be bullish/buy stock signals.
The higher the indicator goes the higher the upward price momentum.
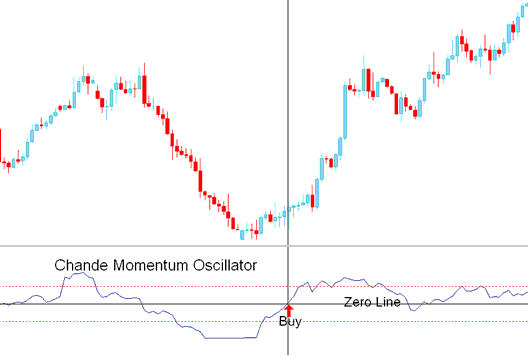
Buy Signal
Sell Trading Signal
Levels below Zero line are considered to be bearish/buy stock signals.
The lower the indicator goes the higher the downwards price momentum.
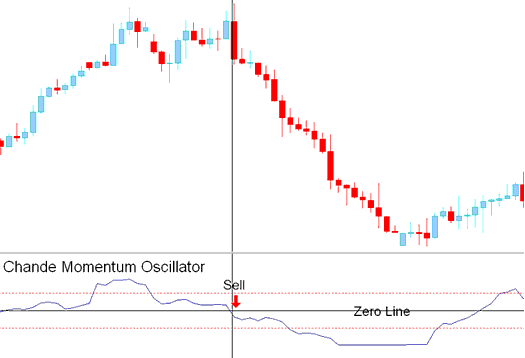
Sell Signal
Study More Topics & Courses:
- McGinley Dynamic Index Indicator Analysis
- How Can I Add DJ 30 in MetaTrader 5 Mobile Trade App?
- What's DAX 30 Strategies?
- DJI30 Indices Strategies
- How Do You Interpret 23.6% Index Chart Fibonacci Pullback Level?
- How Can I Place More Trade Charts in MetaTrader 4 Trading Platform?
- How to Activate a MetaTrader 4 Index Robot on MT4 Software
- EU 50 Pips Calculation for EU50 Indices
- NIKKEI MT5 NIKKEI Platform Software
- Listing of Beginner Indices Strategies for Beginners
