Bilateral/Consolidation Stock Chart Setups Trading
With bilateral/consolidation stock trading chart patterns the market can head in any direction. There are 2 types of consolidation trade patterns that form on charts:
- Symmetric/Symmetrical Triangles - Consolidation Chart Patterns
- Rectangles - Range market
Consolidation Patterns
Symmetric triangles are chart patterns characterized by converging trendlines that indicate a consolidation phase. The buy signal from a symmetrical triangle occurs upon an upward breakout, while a downward breakout serves as a sell signal. Ideally, a market will break out from a symmetrical triangle before reaching the apex of the triangle.
You can draw lines connecting the lowest and highest points of this stable pattern: these lines are even and move closer until they meet at a point. A breakout should happen around 60-80% of the way into the triangle shape. Breakouts that happen too early or late are more likely to fail and less reliable. When the price breaks out, the meeting point becomes an area of support and resistance for the price. The price that has broken out of the stable pattern shouldn't go back past the meeting point. This meeting point is used as a place to set a stop loss for open trades.
When these consolidation setups form we say that the market is taking a break before deciding which is next direction to move.
Consolidation patterns arise from buyer-seller battles. The market pauses on direction.
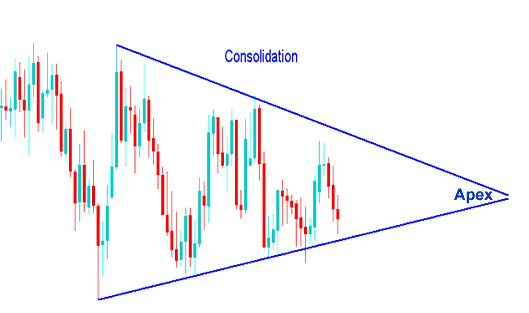
Consolidation Chart Pattern
However, this setup can't go on forever & just like in a tug of war one side eventually will win, looking at the chart below see how the consolidation pattern eventually had a break-out and moved in one direction. Now how do we as traders ensure we are on side that's winning?
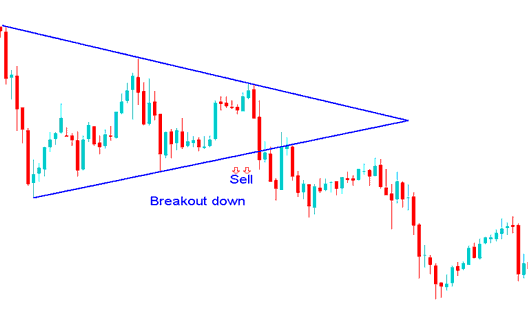
Break-out Downwards Sell Signal after a Consolidation Setup Pattern
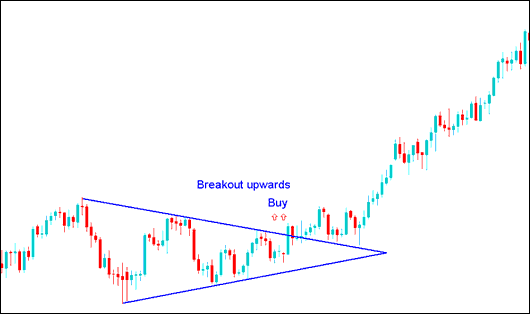
Break Out Upward Buy Trading Signal after a Consolidation Setup Pattern
Returning to our inquiry, how can we guarantee that we are aligned with the winning side?
Here's what we do: we wait for the price to break above or below one of the lines, then place a buy or sell order in that direction. Once the price breaks out from consolidation, if it goes above the upper line, we buy. If it drops below the lower line, we sell.
Alternatively if you don't want to wait out the consolidation, you can use pending orders. If you would want to know more about pending orders go to the lesson: Stop Entry Order Types
The two types of stop orders utilized for trading consolidation patterns are:
- Buy Entry Stop A pending order to open buy at a level that is above trading market price.
- Sell Entry Stop An order to open a sell at a price below trading market price.
These are orders to open a buy trade above the market or to open a sell position below the market.
Rectangle Setup
A rectangle pattern marks tight price ranges in calm phases. Two flat lines set support and resistance. Draw it as a box on charts, so it fits the name.
When prices consolidate, they make several highs and lows that can be connected with straight, horizontal lines that run next to each other. This happens for a long time, giving the trading chart the shape of a rectangle.
A breakout of price action from this consolidation setup occurs when either of the horizontal line is penetrated & the price range of the rectangle is broken. An upside break out is a buy trade signal. A downside breakout is a sell signal.
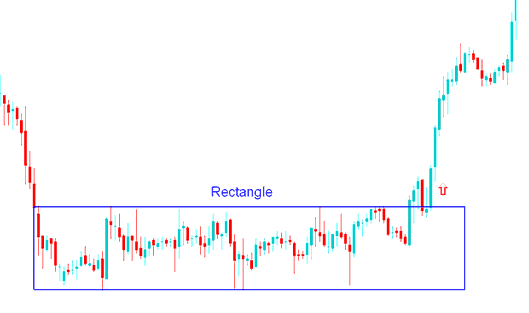
Rectangle Pattern Stock Index - Consolidation Pattern
Price Breaks the consolidation range after sometime & continues to move upward after an upward market break out.
Get More Lessons:
- Shooting Star Candlestick vs Inverted Hammer Candlestick Pattern
- Stock Index Softwares for Beginner Traders
- How Do You Analyze Fibo Extension Levels Indicator in Trading Software Platform?
- How to Analyze Index Strategies
- Index Brokers Type
- What is S and P 500 Chart?
- How Can I Add IT40 in MetaTrader 4 Android Trade App?
- Index Trading Strategy Tips
