Inverted Hammer Candlestick and Shooting Star Candlesticks
Bullish Indices Candlestick Patterns Tutorial Guide & Bearish Stock Candle Patterns Lesson Guide
Inverted Hammer Candlestick Pattern and Shooting Star Candlestick Pattern candlesticks look alike. These have a long upper shadow and a short body at the bottom. Their fill color doesn't matter. What matters is the point where these candlesticks appear whether at the top of a market trend (star) or bottom of price trend (hammer).
The distinction lies here: the inverted hammer configuration signals a bullish reversal, whereas the shooting star configuration signals a bearish reversal pattern in trading.
Upwards Trend Reversal - Shooting Star Candlesticks
Downwards Trend Reversal - Inverted Hammer Candlesticks
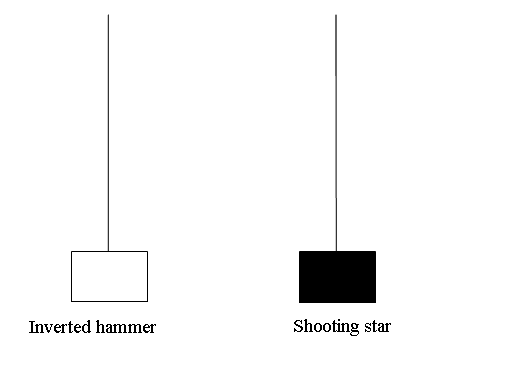
Inverted Hammer Candle Pattern and Shooting Star Candlestick Pattern Setups
Inverted Hammer Trading Candlestick
This represents a bullish reversal candlestick pattern, which forms at the bottom of a market trend.
An inverted hammer happens at the bottom of a downtrend and it may mean that the downtrend could reverse.
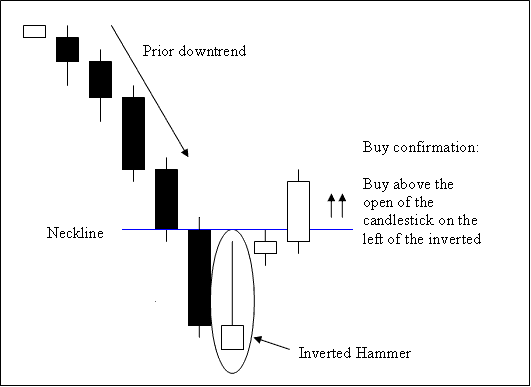
Inverted Hammer Candle
Analysis of the Inverted Hammer Trading Candle-stick
A buy happens when a candle closes higher than the neckline: this is when the candle opens on the left side of the pattern. The neckline here acts like a ceiling.
Buy stock stop orders ought to be positioned a few pips beneath the lowest stock price recorded at the most recent low point.
Inverted hammer candle is named so because it demonstrates that the stock market is hammering a bottom.
Shooting Star Candle
This is a bearish reversal candle pattern. It forms at top of a market trend.
It occurs at the top of an up trend where the open price is same as the low & price then rallied upwards but was forced back downwards to close at near the open.
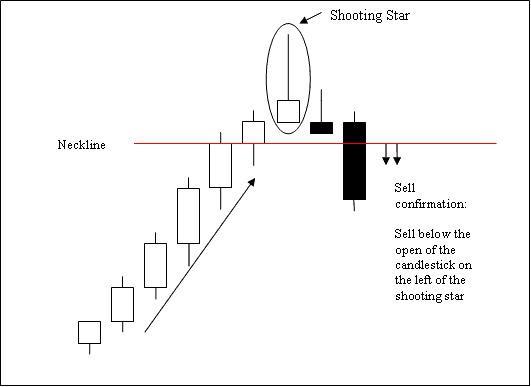
Shooting Star Candlestick
Trading Analysis of the Shooting Star Candle
A sell happens when a candle closes under the neck-line, which is the start of the candlestick on the left side of this pattern. The neckline here is a support area.
Sell stop orders for stock positions should be established just a short distance above the peak stock price recorded in the recent high period.
The Shooting Star candlestick is named that way because when it's at the top of an rising market, this stock candle looks like a shooting star in the sky.
Study More Guides and Topics:
- How Can I Avoid Losing Money in Stock Index Trade
- MA Indices Analysis Strategies
- How Can I Add Dow Jones 30 in MT4 iPad Trade App?
- FTSE MIB Strategy and FTSEMIB 40 Strategy
- Kauffman Efficiency Ratio Index Trade Indicator Analysis
- RSI Index Strategy: 50 Center Line Cross-over Indices Method
