DeMarks Technical Analysis & Range Expansion Trading Signals
Developed & Created by Tom DeMark.
DeMarks used the Range Expansion Index to trade options, in his strategy. This trading technical indicator is an oscillator indicator.
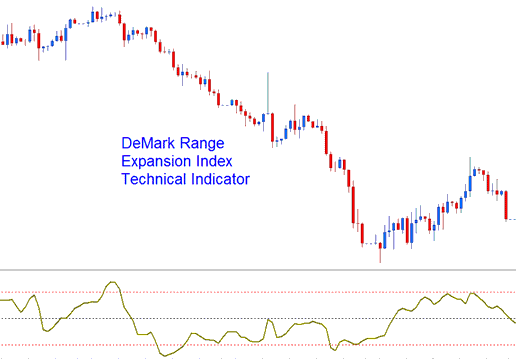
DeMarks Range Expansion Index
This Oscillator Technical Indicator works as a timing tool for the market and tries to fix problems found in oscillators that use exponential calculations. These other oscillators use arithmetic calculations and tend to be slow to react to market changes.
Technical Analysis and How to Generate Trading Signals
This Oscillator Indicator commonly oscillates between the values of -100 to +100.
Overbought tiers - Readings of +forty five or better shows overbought conditions.
Oversold zones are indicated by readings of -45 or lower, which signify oversold conditions.
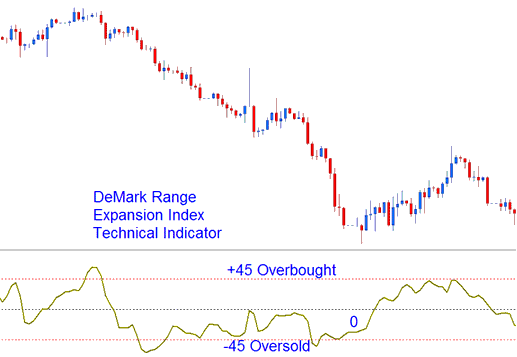
Over-bought and Oversold Levels on Indicator
Exit Signals - DeMark advises against trading in extreme overbought conditions indicated by six or more bars above +45, exit for buy signals is generated six bars after price hits +45.
Exit signals pop up when you see six or more price bars below the -45 threshold, which means it's time to close your short trades.
Study More Topics & Lessons:
- Bollinger Band: Fib Ratios Indices Indicator Analysis
- Grid, Volumes, AutoScroll and MetaTrader 4 Chart Shift on MT4 Software
- Trade Nasdaq Stock Index Strategy
- How Can I Add SPAIN 35 on MetaTrader 4 Android Phone Trade App?
- SX 50 Trading Strategies Guide Lesson
