RSI Trade Strategy
- RSI Over-bought and Over-sold Levels
- Relative Strength Divergence Setups
- RSI Classic Bullish and Bearish Divergence
- RSI Hidden Bullish & Bearish Divergence
- Swing Failure Method
- RSI Chart Setups and Patterns Trendlines
- RSI Summary
Relative Strength Indicator Strategy
RSI or RSI is one of the most popular/liked stock indicator used in indices. It is an oscillator stock indicator which oscillates between 0 -100. This is a market trend following indicator. It shows the strength of the market trend, values/readings above 50 indicate a bullish trend while values/readings below 50 indicate bearish market trend.
RSI Indicator Estimates Momentum of a Trend.
The midpoint for the RSI indicator is set at 50: when the indicator line crosses this centerline, it signals a transition from a bullish to a bearish trend, or vice versa.
When the RSI is above 50, it indicates that buyers possess greater momentum than sellers, and the stock price on the trading chart will continue to rise as long as this RSI remains above 50.
When it's below 50, sellers are stronger than buyers, and the price on the stock chart will keep dropping as long as RSI stays below 50.
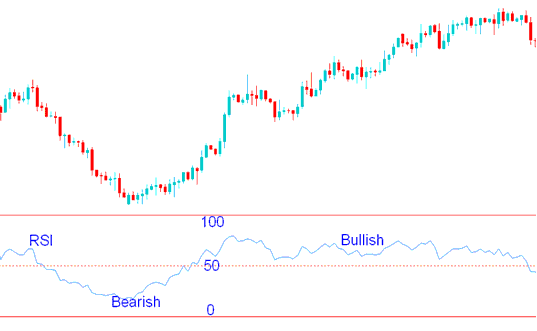
RSI Indicator - How to Trade with RSI Indicator
In the trading example illustration shown above, when the trading indicator is below 50, the trading price kept moving in a downward stock trend. The trading price continues to move down as long as RSI was below 50. When the RSI moved above 50 it showed that the energy had changed from sell to buy and the downward trend had ended.
When the RSI went above 50, the trading price began going up and the trend changed from going down to going up. The stock trading price kept going up and the RSI stayed above 50 after that.
Examining the trading illustration provided above, it is observed that during periods of a prevailing bullish market trend, the RSI indicator would occasionally decrease but consistently fail to breach the 50 mark. This behavior confirms that such downward movements are merely temporary retracements, as the general price trajectory throughout this period remained definitively upward. As long as the RSI maintains a position above 50, the current trend is considered structurally sound. This underscores why the 50-line serves as the critical dividing mark for differentiating between bullish and bearish signals in stock trading.
The default period for the RSI technical indicator is set at 14 days, a duration suggested by J. Welles Wilder when he first created the indicator. Traders frequently employ other periods, such as the 9-day and 25-day moving averages.
The RSI tool period used depends on the chart's time frame you are using to trade: if you're using a day chart, the 14 period means 14 days, but if you use a 1H chart, the 14 period means 14 hours. For our stock example, we'll use a 14 day moving average, but for your trading, you can change the day period to the chart time frame you are indices trading with.
To Calculate RSI:
- The No. of days that a stock market is up is compared to the number of days that the trading market is down in a given time period.
- The numerator in the basic formula is an average of all the trading sessions that finished with an upward stock trading price change.
- The denominator is an average of all the downward trading market sessions closes for that period.
- The average for the down days is calculated as absolute numbers.
- The Initial RSI is then turned in to an oscillator.
At times, very big price changes up or down during one trading session may throw off the RSI average calculation and create a wrong signal, or a fake-out signal, which looks like a spike.
RSI Center-line: The center-line for this indicator is 50. A value above 50 implies that the trend is in a bullish phase as average gains are greater and higher than the average losses. Values below 50 indicate a bearish phase in the trading market prices are in general closing lower than where it's that they opened.
Overbought and Oversold Lines: Wilder set RSI levels at 70 and 30 for when markets stretch too far.
Study More Guides and Courses:
- Stock Index Strategies S&P
- All About Indices Trade
- How to Generate Trade Signals with a Index Trading Strategy
- Where Can Get NKY225 on MT5 Platform?
- UsTec 100 Strategy How to Create Trading Method for Trading UsTec 100 Training Course
- How is SWI 20 Traded Online in the MT5 Trading Platform?
- How Can I Find GER30 in MetaTrader 4 iPhone Mobile App?
- Desktop Indices Trade Platform/Software for PC
