MACD Strategies
- MACD Fast Line and Signal-line
- MACD Buy and Sell Trading Signals
- MACD Whip-saws Fake Out Signals
- Generating Center Line Crossover Signals
- MACD Classic Bullish & Bearish Divergence Trade Setup
- MACD Hidden Bullish & Bearish Divergence
- MACD Summary
MACD Centerline Cross-over
The MACD indicator is one of the most widely & often used technical indicators available. MACD indicator is a momentum oscillator trading with some trend following characteristic tendencies.
The MACD tool is one of the most well-known and liked tools used to study stocks. The MACD tool is used to make stock signals using points where lines cross.
MACD shows how moving averages(MAs) come together and move apart. The MACD indicator is made using Moving Average analysis. Moving Average Convergence/Divergence is a tool that follows trends. MACD shows the link between two MAs.
One moving average is of a shorter length and the opposite for an extended length of inventory charge bars.
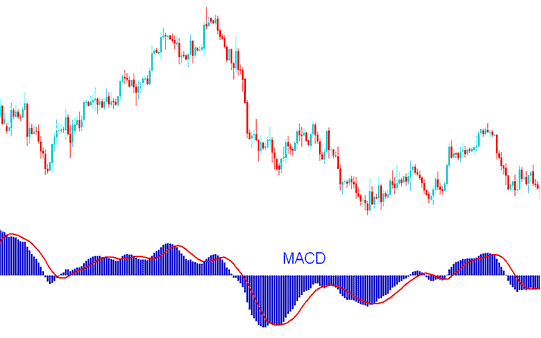
MACD Indicator - MACD Indicator Analysis
MACD indicator has got a zero center line: values above zero mark are bullish while those below the zero are bearish.
During an uptrend, the short MACD line climbs faster than the long one, creating that familiar gap. As long as the MACD stays above the center line, you're still looking at a bullish trend - check out the example below.
Don't sell if the MACD Indicator is above the Center Line because this area is good for buying. It doesn't matter how it moves, as long as it stays above the zero center line, like in the pictures below.
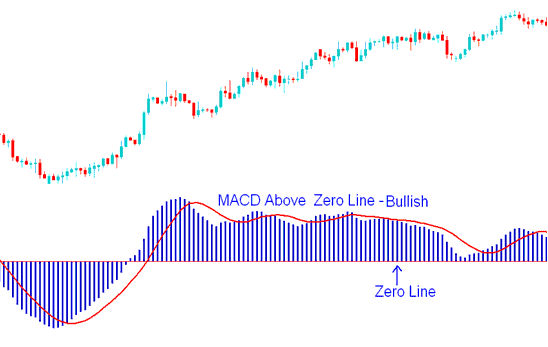
MACD Indicator Above Zero Mark - Bullish Signal
In a downtrend, the short MACD line drops quicker than the long one, opening a gap. If it stays below the center line, the bearish trend continues.
Do not buy as long as the MACD Indicator is below the Center Line - this is bearish region and it doesn't matter how it's moving as long as it is below the zero center line, as shown on the illustrations illustrated and shown below.
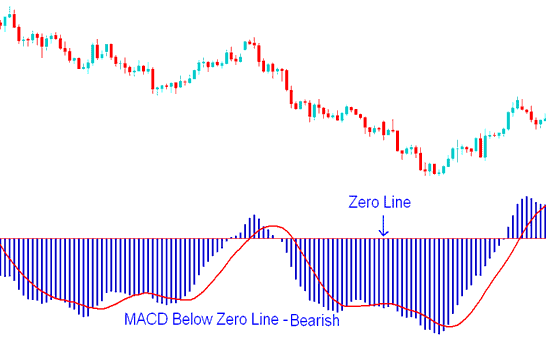
MACD Indicator Below Zero Center Line Mark - Bearish Trading Signal
When a trend is about to change and reverse, the MACD lines begin to converge, thereby reducing the gap between them.
Get More Topics and Tutorials:
- MT4 Index Software Platform Download on PC
- Technical Analysis of Trend Trade in Stock Indices
- How Can I Place EU 50 in MT4 iPad Mobile App?
- How Do I Trade SX 50 Training Tutorial?
- How to Analyze a Upwards Trend on Charts
- MACD Index Trade Whipsaws and Fake Out Signal on Bearish and Bullish Territory
- Stock Index Multiple Chart Time Frame Stock Index Trade Analysis
- How Can I Find DJ30 in MetaTrader 4 App?
- How to Predict Indices Charts using Charts Patterns Analysis
