McClellan Oscillator Indices Technical Analysis & McClellan Oscillator Signals
Developed by McClellan.
The McClellan Oscillator is an indicator that is based on smoothing the difference between the No. of bullish candlesticks & bearish candlesticks. This technical indicator looks similar to the traditional MACD indicator.
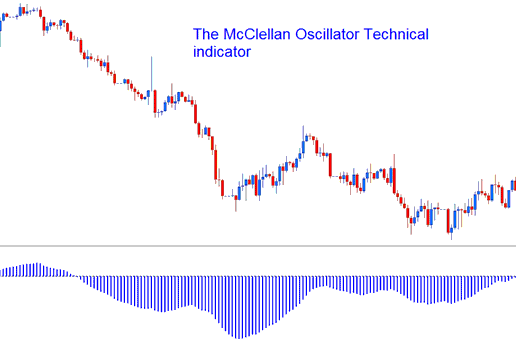
McClellan Oscillator Indicator
Indices Technical Analysis and How to Generate Trading Signals
This tool shows how strong the price changes are and can be traded the same way as the MACD tool. There are three ways that the McClellan Oscillator Tool can be used to make signals.
Zero Centerline Crossover Signals:
Bullish signals occur when the oscillator line crosses above the zero line. This creates a buy signal for stocks.
Bearish Signals- When oscillator crosses below zero center-line a sell stock signal is given.
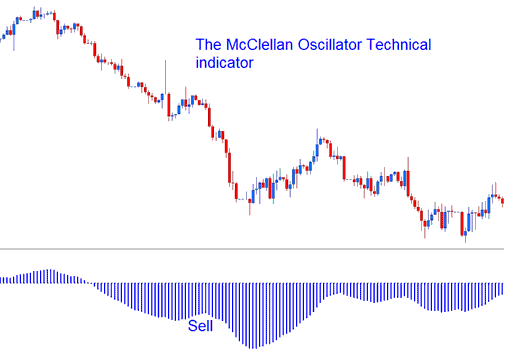
Technical Analysis in Indices Trade
Divergence:
Looking for divergences between the McClellan Oscillator and stock trading price can prove to be very effective in spotting the potential reversal and/or trend continuation points in price movement.
There are several types of divergences:
Classic Stock Index Trade Divergence (Regular Stock Index Trade Divergence)
- Bullish Divergence: Lower lows in price action and higher lows in the McClellan Oscillator.
- Bearish Divergence: Higher highs in price & lower highs in the McClellan Oscillator.
Hidden Stock Index Trade Divergence Trading Setup
- Bullish Divergence: Higher lows in price action and lower lows on the McClellan Oscillator Indicator.
- Bearish Divergence: Lower highs in price action & higher highs in the McClellan Oscillator Indicator.
Over-bought/Oversold Levels in Indicator
The McClellan Oscillator is also used to identify the potential over-bought and over-sold levels in price action movements. The overbought and oversold conditions are derived & generated when the oscillator indicator moves to extreme levels on one side & starts to turn, however, in a strong trending market the oscillator will stay in the overbought and over-sold levels for a long time. It is not recommended to trade overbought and over-sold levels to generate signals. The best signal to use is the Center Line cross over signals to generate trade signals.
Learn More Lessons and Tutorials and Topics:
- What's AEX 25 Trading Strategy?
- How to Add IT40 on MT5 Android Trade App
- Regulated Indices Trade Broker Lesson Tutorial
- How is WallStreet30 Index Traded Online in the MetaTrader 4 Software Platform?
- How to Place EU 50 in MetaTrader 4 iPad App
- Stock Index Leverage and Stock Index Trade Margin
- MT4 Volumes Indicator Stock Indices Indicators for Day Trading
- Chart Time Frames for Trading Indices
- How Do You Analyze the Three Types of Index Charts?
- DJ 30 Market Close Time
