MT4 Live Charts
Upon establishing a practice account, the next step is to open a chart to commence trading.
For this examples let's begin with a blank screen on the MetaTrader 4 software workspace.
To start a new stock chart from the example that is explained and shown below, click the 'File' tab at the top left of the MetaTrader 4 program as shown below, and then pick the option called 'New Chart'.
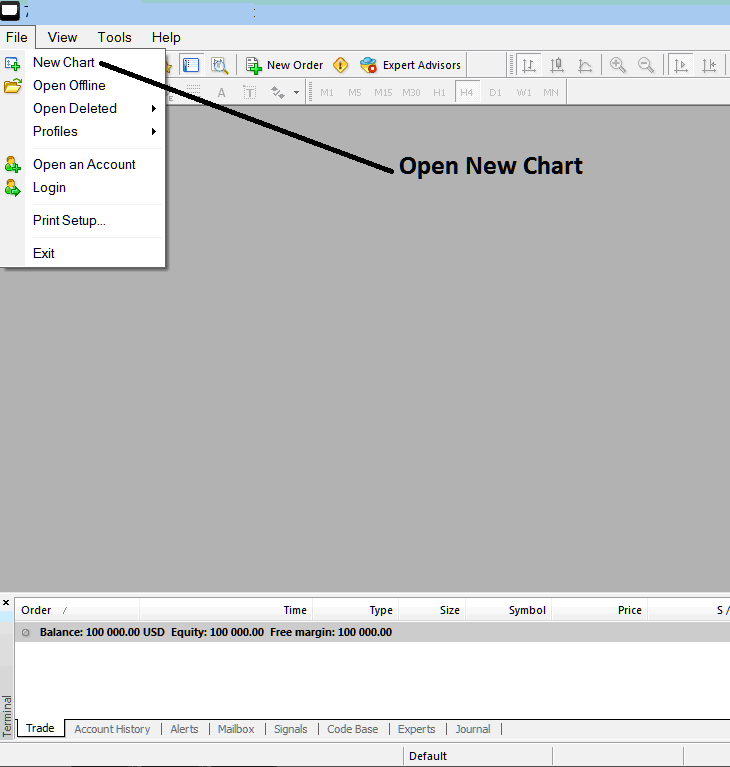
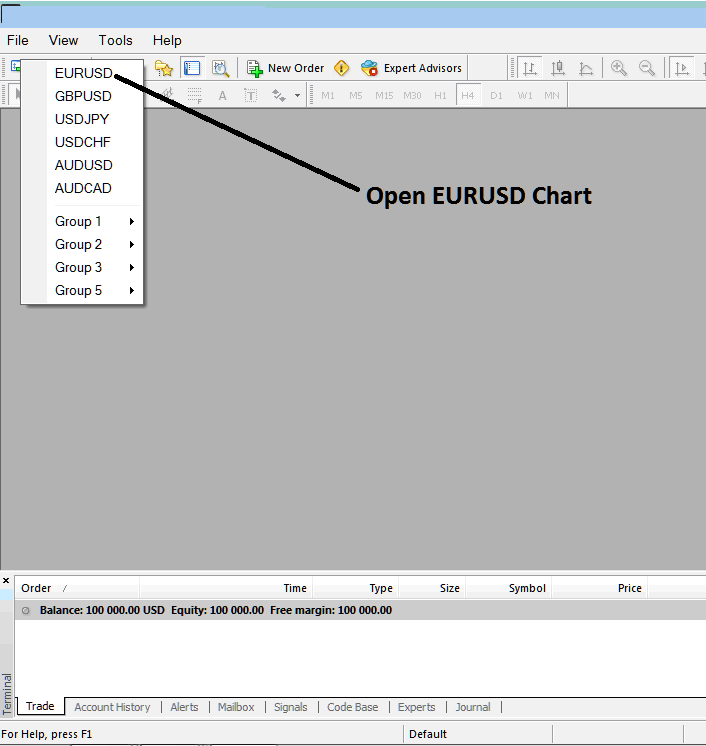
Click the New Chart button to see a menu drop down. It lists trading tools to pick from. Choose one, like Indices, to open its chart.
The subsequent stock chart will be displayed on MT4 software as illustrated below.
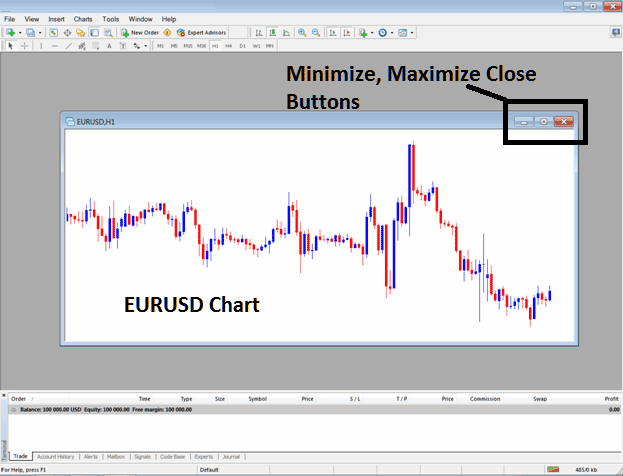
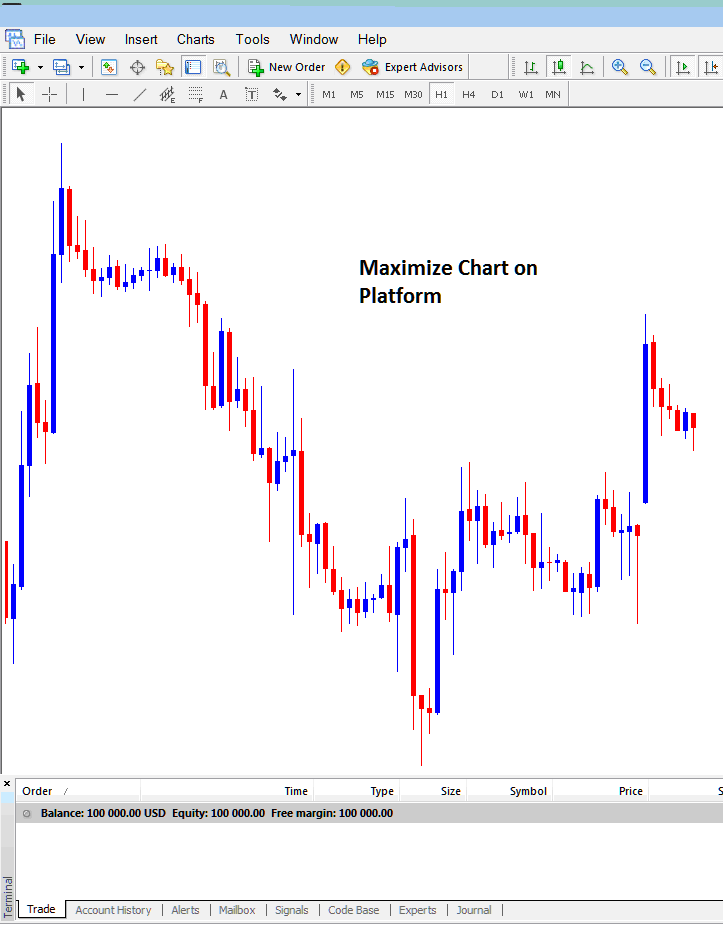
You can make the chart bigger like in the picture, and then you can make trades from the charts, or you can add tools to analyze and understand how the price is moving.
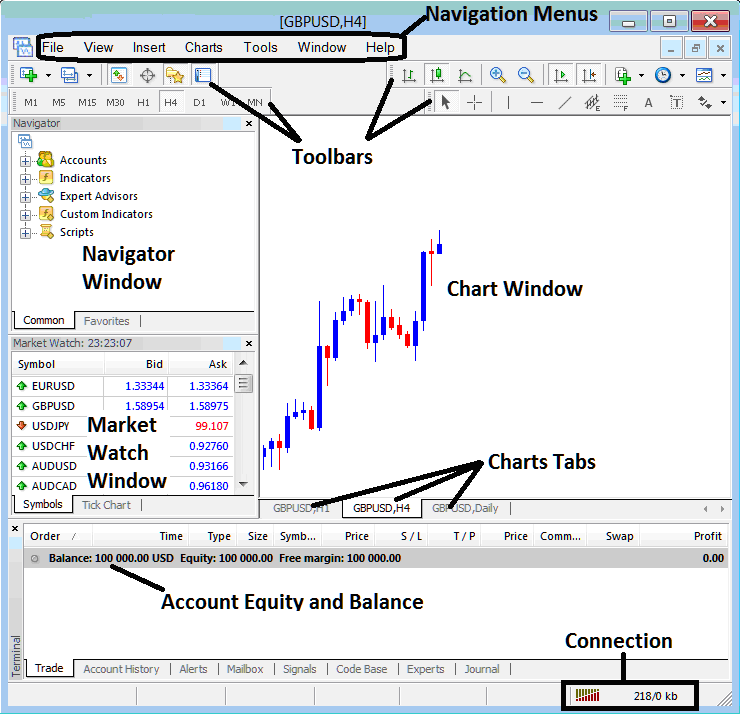
To initiate a new stock chart on the platform, you can create numerous charts as desired, and these will be arranged as chart tabs. Navigation through these tabs can be done as demonstrated in the example below.
Learn More Topics and Tutorials:
- Stock Index Guides for Beginner Traders and Learn Stock Indices Analysis
- How Do I Trade Stock Index with MACD Fast Line & MACD SignalLine?
- How to Place Awesome Oscillator Stock Indices Indicator in MT4 Software Platform
- What is Demo Account MT4 Trade Platform?
- How Can I Add Trade ADX Indicator on Chart?
- How to Add Stock Index Trade Custom Indicators on the MetaTrader 4 Platform
- GER30 Pip Calculation for GER 30 Indices
- How Can I Add SWI 20 in MetaTrader 4 Mobile Trade App?
