Bullish Stock Index Candle Patterns and Bearish Stock Index Candle-stick Setup Patterns
Bullish Candlestick Patterns Tutorial Course & Bearish Stock Index Candle Patterns Lesson
A Piercing Line Stock Index chart pattern and Dark Cloud Indices chart pattern seem alike, but one shows up when a Stock Index is trending upward (Cloud Cover), and the other shows up when it's trending downward (Piercing).
Upward Stock Index Trend Reversal - Dark Cloud Cover Candles
Downward Indices Trend Reversal - Piercing Line Candles
Piercing Line Candlestick
A Piercing line consists of a long black body followed by a long white body candlestick.
The white body pierces the midpoint of the previous black body.
This setup signals a bullish market reversal at the end of a downtrend. Basically, it means the market opens lower but then closes above the middle of the previous black candle.
This emphasizes that the strength of the downward trend is waning, and the market trend is likely to reverse and ascend in an upward direction.
This pattern is illustrated are referred to as a piercing line signifying and signaling that the market is piercing the bottom illustrating a market floor for price downwards trend.
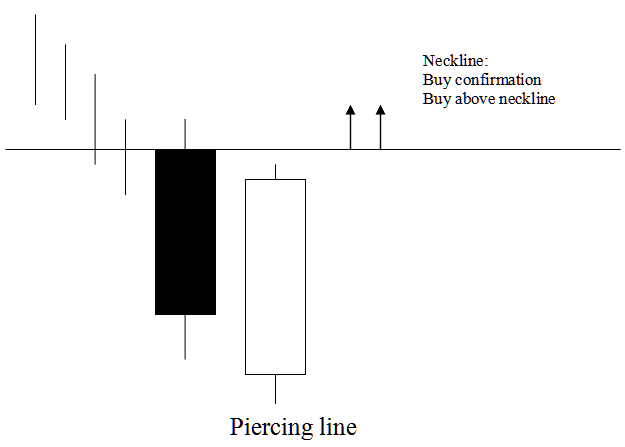
Piercing Line Candle
Analysis Piercing Line Candlestick
A buy signal gets to be confirmed once price closes above neck-line which is the opening of the candlestick on the left of the Piercing Line candle.
This is a sign that prices will go up, and the price should keep going up: a trader who buys should also put a stop loss just below the area with the lowest price.
Dark Cloud Cover Candlestick
Opposite of piercing candlestick.
This candlestick is a long white body that is followed by a long black body.
The black body pierces the mid point of the prior white body.
This configuration represents a bearish market reversal pattern that materializes at the peak of an upward trend.
It shows that the market opens higher & closes below mid point of the white body.
This shows the uptrend loses power. The market may turn down soon.
This setup is illustrated are known as a cloud cover signifying the cloud as a ceiling for price upwards trend.
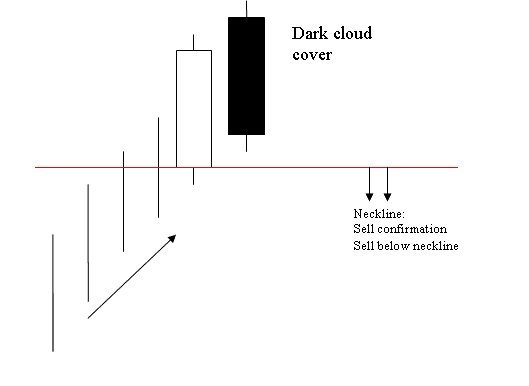
Dark Cloud Candlestick
Analysis Dark Cloud Cover Candlestick
A signal to sell is confirmed when the price closes below the neck-line, which is the start of the candlestick on the left of the candlestick.
This scenario indicates a bearish outlook, suggesting the price is expected to continue descending: consequently, a trader initiating a short position should place a stop-loss order just above the highest price reached.
Study More Guides:
- Learn How to Trade NKY 225 Stock Index Guide Tutorial
- Download Indices Trade MetaTrader 5 for Android
- Indices Trade Web Stock Index Trade in MetaTrader 5 Webtrader
- How to Place SMI20 in MetaTrader 4 Android App
- How to Add SPX in MetaTrader 4 iPhone App
- SWI 20 Strategies How to Make Strategies for SWI 20 Training Course
- 1H Day Trading Stock Index Trading Strategy
- What's The SX5E Index in Trading?
- Index JP225 in Forex Trading
