Pivot Points Analysis and Pivot Point Signals
This indicator features a central pivot surrounded by three resistance levels below and three support levels above.
Floor traders first used these points for equities and futures. The indicator leads rather than lags.
Pivots offer a simple way for stock traders to study and understand the overall direction the market is likely to move during the trading day. Simple math is used to find the areas of resistance and support.
To calculate these points for the coming day, the previous day's
- high,
- low, and
- closing prices are used
The trading day concludes, and this daily closing time is when the indicator receives its update.
The calculations for this trading technical indicator's 24-hour cycle utilize a sophisticated formula. The center pivot point is employed to assess the areas of support and resistance as outlined below:
Resistance 3
Resistance 2
Resistance 1
Pivot Point
Support 1
Support 2
Support 3
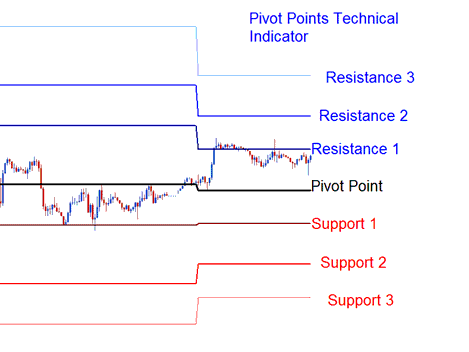
Indices Analysis and Generating Signals
This indicator can be used in different ways to generate trade signals. The following methods are the most common technical analysis:
Indices Trend Identification Signals
The center pivot is used by stock traders to identify the general market trend direction. The trade positions taken and opened will only be in direction of the trend.
- Buy signal - stock trading price is above the central point
- Sell signal - stock price is below the central point
Indices Price Break-out Signals
Index Price break out signals are derived and generated as follows
- Buy signal- is generated when the price breaks upwards through the central point.
- Sell signal- is derived & generated when the price breaks out downward through the central point.
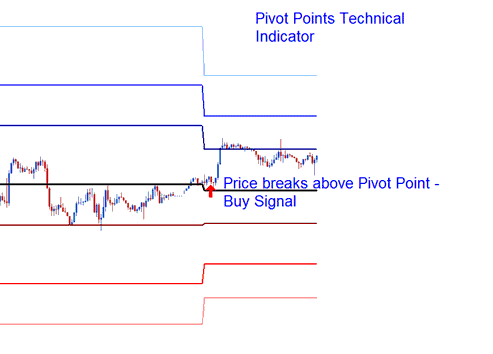
Indices Price Break-out
Index Price Reversal Signal
Indices Price reversals are derived and generated as follows
Buy Signal- when trading price moves down towards one of the support area, then touches the support or moves slightly through it then quickly reverses and moves upwards.
Sell Signal- when the price goes up toward a level where it usually stops, touches it or goes a bit past it, then quickly turns around and goes down.
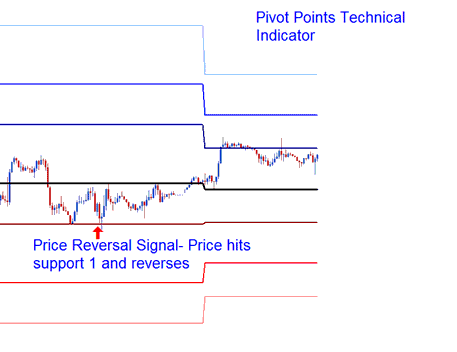
Indices Price Reversal Signal
Setting Stop loss and Limit Profit Values
Stock traders use the central pivot and support or resistance levels to set stop losses and take-profit points.
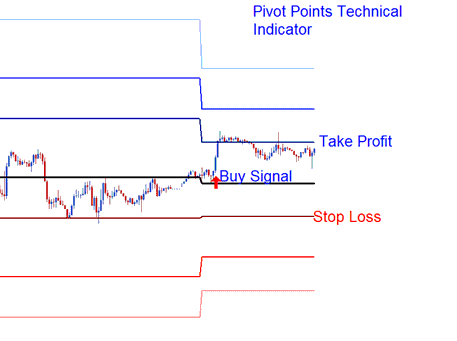
Setting Stop loss and Limit Profit
If a buy signal happens above the middle point, Resistance One or Resistance Two can be used to decide where to set the take profit order, and Support 1 can be used as a Stop Loss Zone for the position.
To download Pivot points Trading Indicator:
https://c.mql5.com/21/9/pro4x_pivot_lines.mq4
Once you download the indicator. Open it with the MQL4 Language Meta Editor, Then Compile the indicator by pressing the Compile Button and it will be added to your MT4.
NB: Once you as a trader add it to your MT4, the indicator has extra additional lines marked Mid-Points, to remove the additional lines open MQL4 Meta Editor(short cut keyboard key - press F4), and change line 16 from:
Extern bool midpivot = true:
To
Extern bool mid-pivot = false:
Subsequently, depress the Compile button once more, and the indicator will be displayed exactly as illustrated on this online location.
Get More Topics and Lessons:
- How Can I Find WallStreet30 in MetaTrader 4 iPhone Trade App?
- RSI Index Hidden Bullish Divergence and RSI Hidden Bearish Trading Divergence Trading Setups
- SX 5E Indicator MetaTrader 4 Technical Indicators Defined
- Creating a Stock Index Strategy To Trade Index with Systems
- What's NETH 25 Spreads? NETH 25 Bid/Ask Spreads
- How Can I Add CAC40 Index in MetaTrader 5 Android App?
- Aroon Stock Indices Indicator Analysis on Stock Index Charts
- MetaTrader 4 Demo Index App
