Recursive Moving Trend Average Analysis and Trade Signals
This indicator uses a math-based polynomial fit called a recursive moving polynomial fit.
The mathematical formula underpinning this technical indicator necessitates only a minimal quantity of preceding data to forecast the subsequent trajectory of the market price. The demonstration explained and depicted below illustrates the combination of two Recursive Averages to construct a trading methodology based on crossover signals.
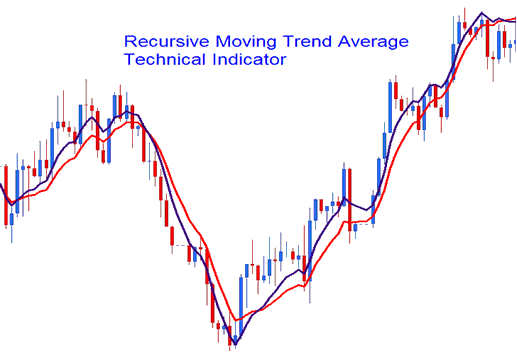
Stock Analysis and How to Generate Signals
The best way to look at trades is to combine two averages that look back over time, like the 14 and 21. When the two lines cross up, it means buy, but when they cross down, it means sell.
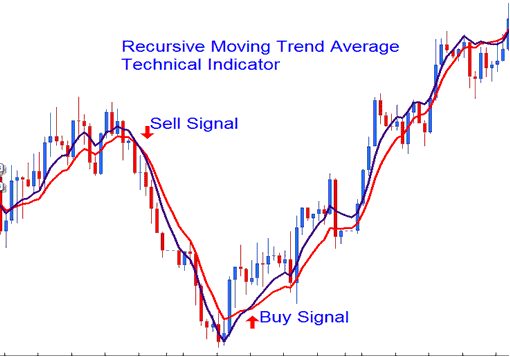
Buy Sell Trade Signal
The Recursive Average looks very similar to the traditional Moving Average, the only difference is that is much smoother due to the method of calculation which it uses & much less prone to fake outs.
More Topics:
- How to Write a Stock Index Business Trade Plan Example
- Index Indicator MA Whipsaws in Range Market
- What's MAs Moving Averages Crossover Indices System?
- Index Divergence Example
- MetaTrader 4 Stock Index Strategy Tester Window
- Support and Resistance Indices Indicator
