Indicators for Setting Stoploss in Indices Trade
Some technical indicators help you set stop losses, which means you don't have to do a bunch of tricky math to figure out where to put your stop orders.
A systematic trader can also position a stop-loss order based on these indicators. Certain technical indicators employ mathematical formulas to ascertain the optimal placement for a stop-loss order to ensure an ideal exit point. These trading indicators serve as the foundation for setting stop-loss placements. They meticulously follow the price fluctuations of a traded instrument, defining the expected boundaries within which prices should fluctuate. If the price action ventures beyond these established limits, it is prudent to close any open positions, as the momentum in that specific direction is likely ceasing.
Some of the Indicators that can be used to set stop losses are:
Automatic Stop Loss Order and Take-Profit Indicator
Parabolic SAR is like an Automatic Stop Loss Order and TP Order Indicator used to set a trailing price stop loss
Parabolic SAR provides excellent exit points.
In an upward trend, you should close long trades when the price falls and drops below the Parabolic SAR indicator
In downtrends, exit short positions here. Close when price tops the Parabolic SAR.
When you are in a long position, the price remains above the parabolic SAR, which will consistently move upwards each day, irrespective of the price direction. The extent to which the Parabolic SAR ascends is contingent upon the movement of stock trading prices.
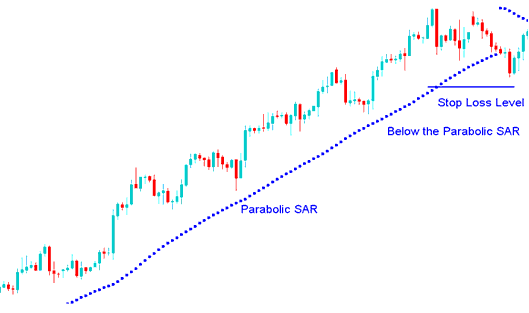
Parabolic SAR - Indicator - Automatic Stop Loss Order and TP Order Indicator
Picture of parabolic SAR & how it's used
Indicator for Setting Stop Loss Orders
Bollinger Band indicator use standards deviations as an estimate of the volatility. Since standard deviation technical indicator is a measure of volatility, the Bollinger bands are self-adjusting meaning they widen during periods of higher volatility and contract during periods of lower market volatility.
Bollinger Bands indicator consist of 3 bands designed to encompass the majority of a trading instruments trading price action. The middle band is a basis for the intermediate-term market trend, typically it's 20 period simple MA, which is also the base for upper & lower bands. The upper band's distance and lower band's distance from the mid band is determined by the volatility of price.
Because the Bollinger Bands cover the price's movement, they can be used to decide where to put stop loss orders beyond the band lines.
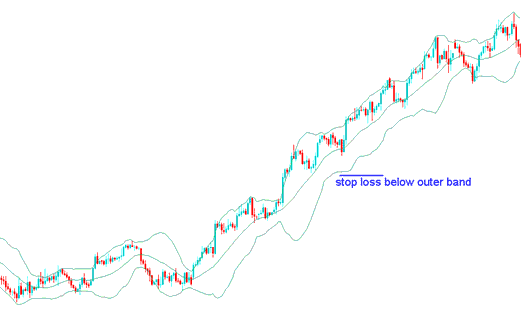
Bollinger Band Setting Stop Loss Order Level - Bollinger Band Technical indicator
Automatic Stop Loss Order & TP Indicator
Fibonacci retracement levels provide areas of support & resistance, these can then be used to set stoploss order levels.
Fib Retracement level 61.80 % is the most often used level for setting stop loss orders. A stoploss order should be placed just below 61.8% Fib retracement level
The 61.80% Fibonacci retracement level is commonly employed to place orders, as it is infrequently attained.
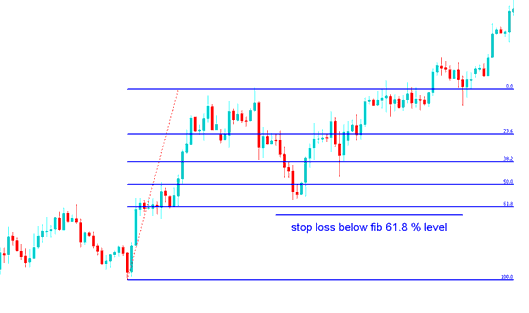
Fib Indicator Stop Loss Order Setting at 61.80% Retracement Level
Fib retracement level 61.8% - Fib Indicator
Support & Resistance Levels Lines
Support and resistance levels can be used to set levels for stoploss orders, where the stop loss orders are set just above or below the resistance/support.
- Buy Trade - Stop Loss Order set few pips below the support
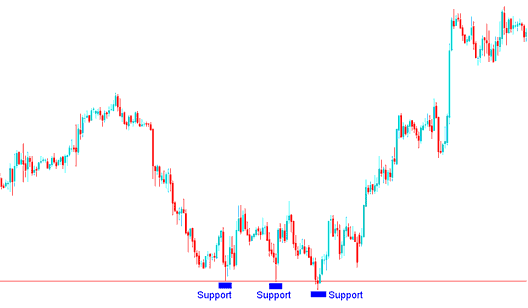
Buy Trade - StopLoss set few pips below the support
- Sell Trade - Stop Loss Order set a couple of pips above the resistance
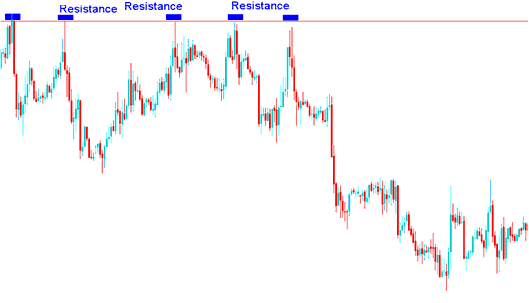
Sell Trade - Stop-Loss Order set a few pips above the resistance
Study More Lessons and Tutorials and Topics:
- How Do Trade AS 51 Index Trading Strategy?
- Fib Levels vs Fibo Pullback Levels
- Learn How to Trade Index Market
- Dow Jones Trading Strategies and Dow Jones Strategy
- DeMark Range Extension Stock Indices Indices Indicator Analysis
- Three Steps To Help Improve Your Stock Index Results
- Commodity Channel Index Index Indicator Analysis
- How is FRA40 Traded Online in the MT5 Trading Platform?
- Best JP225 Trading Strategies
- Bollinger Band Indicator Stock Index Trading Strategy Summary
