How to Use Support & Resistance to Trade Indices
In earlier examples, support and resistance levels held up. They proved too strong to break.
However, sometimes support & resistances levels are not strong enough to stop movement of the price heading in a certain direction. When stock price moves past these support & resistance points we say the levels have been broken. That is why we always use a stoploss order when trading these technical levels, just in case they do not hold.
But what happens when these areas are broken, well these levels change from one to the other, for example
- When a support level is broken it turns into a resistance
- When a resistance level is broken it turns into a support
Using charts, the illustration put on display below shows an example illustration of what happens when these technical levels break:
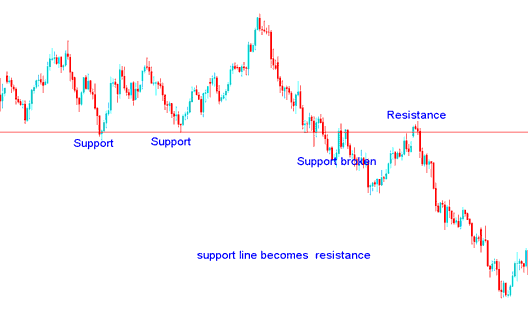
Support level is broken it turns into a resistance
In the example shown and described below, the support, tested twice, failed on the third try, and sellers pushed the price below or past this technical level.
Price bounced back up, but this time it couldn't break through that line. Sellers quickly pushed it back down because the old support had turned into resistance.
In the context of index trading, when a support level is decisively broken, the stop loss orders positioned beneath that threshold are also triggered, thereby depleting the purchasing momentum held by the bulls. This scenario then grants sellers an opportunity to short-sell indices and place their own stop orders just above this price point, which has now effectively converted into a resistance level.
Resistance is broken it turns into a support
In the example explained and shown below using the chart, the resistance area that was tested two times could not hold the third time, the buyers were able to move the price higher than this technical level.
When the market price tried to go down again it couldn't move lower than this technical level. The price was there after quickly pushed further upward by the buyers. This was because the line that was a resistance had now turned in to a support. This is what happens in indices, when a resistance zone is broken it turn into a support level.
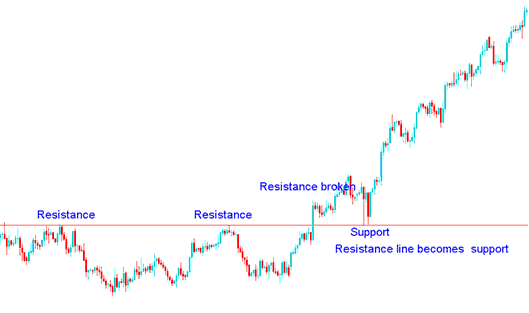
Traders who had ended their short sell stock trades will now start long trades and put their stop losses just under this point.
Major and Minor Resistance Zones
On charts, the areas of resistance and support that appear are either major or minor areas of resistance or support.
Major Resistance/Support levels
In Major Resistance/Support levels price will stay at this level for a while, either the price will consolidate at this point or form a rectangle chart pattern when stock price gets to this point. This level will be tested several times before it's either broken or it holds and stock price doesn't get to move past this resistance support area.
The above example are good examples of major Resistance and Support Areas.
Minor Resistance/Support levels
In minor resistance and support areas the price will form these points quickly in the short term on the chart & then quickly move past these resistance & support point zones.
Up-wards Index Trend: The setup of this minor resistance and support areas will form a sequence of several levels whose general direction is upwards.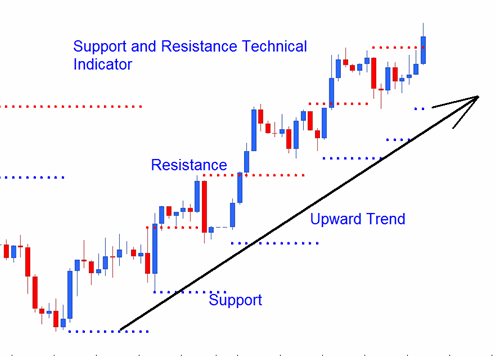
Up-wards Trend Series of Support and Resistance
Downwards Trading Trend: The way this pattern sets up, with small ceilings and floors, will make a series of levels that generally go down.
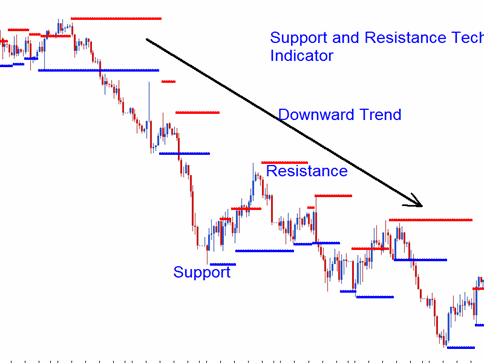
Downwards Trend Series of Support and Resistance
Learn More Tutorials and Courses:
- Trade IBEX 35 Strategy
- What's DJ 30 1 PIP Point Move Eqivalent to?
- Combining Together Stochastic Trading Indicators Indices Strategies
- Bulls Power Indices MT4 Indicators Download
- How Do You Analyze Index Chart for Beginner Traders?
- Index Divergence Setups of M-Shapes Stock Index Price Highs & W-Shapes Index Price Lows
- Index Trade UsTec 100 in FX
