Pin bar commodities price action method
A pin bar is a reversal signal on a chart which portrays an obvious change in sentiment during that trading period.
This bar has a long tail with the closing price near the open.
The bar looks like a pin thus its name Pin Bar - forms after an extended trend move up or down.
This reversal is confirmed after market closes below the candlestick that precedes this pattern. Below the reversal is confirmed after the market closes below the blue candlestick that preceded this candlestick.
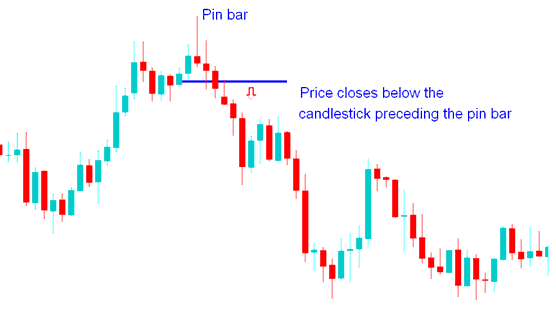
Combining with line studies:
This signal can be combined with other line studies such as Support and Resistance levels, Fibonacci retracement levels and trendlines can be used together with this signal to generate buy or sell commodities trades.
Support and resistance
A pin bar that forms after commodities trade price hits an important support or resistance level can be used as a signal to enter the market. When this pattern forms the trades taken should be in the opposite direction of the tail.
If the market moves up this forms a pin bar with tall upper tail, then the signal is to short.
If the market moves down the forms a pin bar with tall lower tail, then the signal is to long.
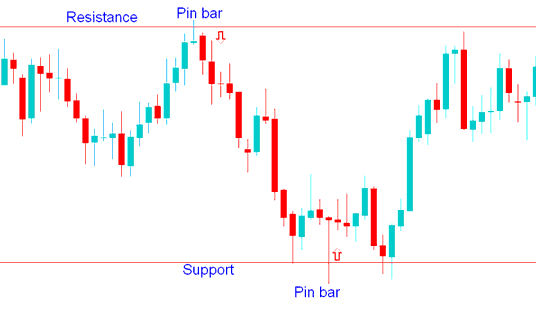
Combining With Support and Resistance
Trendlines & moving averages
Pin bars that form after commodities price touches a trend line or moving average can be used as signals to enter the market.
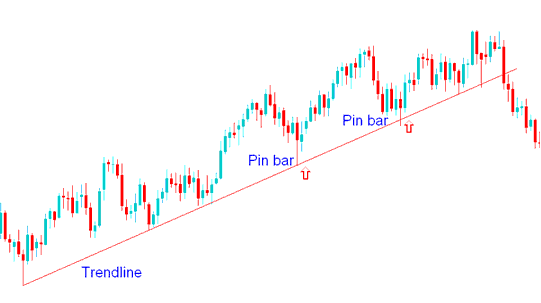
Combining With Trendlines
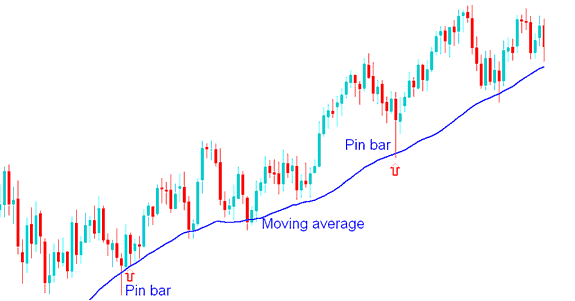
Combining With Moving Averages
Commodity Trading Fibo Retracement Levels
Pin bars that form after commodities price touches a Fibonacci retracement level can also be used as signals to enter the market.
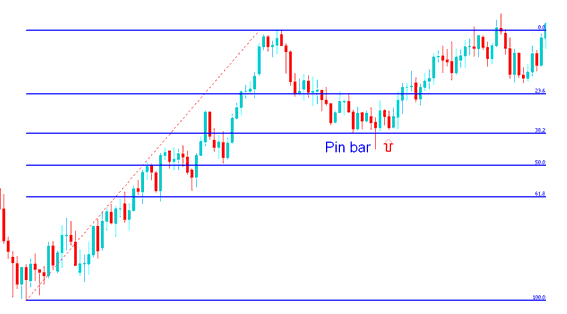
Combining With Commodities Trading Fib Retracement Levels
These trading patterns are often formed near extremes in market swings, and they often happen at after false breaks. This is why this pattern is used to place trades in the opposite direction of the tail.


