Recursive Moving Trend Average Commodities Technical Analysis and Trading Signals
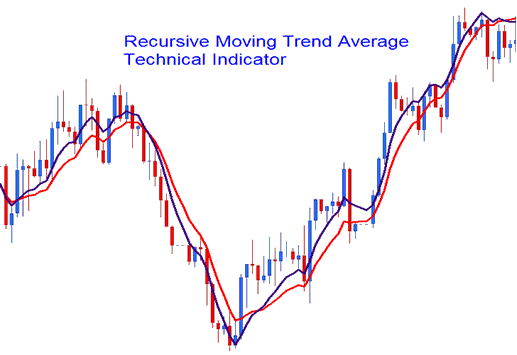
This Technical Indicator is calculated using a math polynomial fit, the formula is referred as a Recursive Moving Polynomial Fit.
This formula used to calculate this indicator only requires a small set of previous data to calculate and predict the next direction of commodities trading price movement. The example illustrated and explained below shows two Recursive Averages combined to form a crossover commodity system method.
Commodities Technical Analysis & How to Generate Trading Signals
The best technical analysis method is the cross over method where you can combine two recursive averages, such as the 14 & 21. When the two cross overs each other upwards then that's a bullish trading signal while a downwards crossover is a bearish signal.
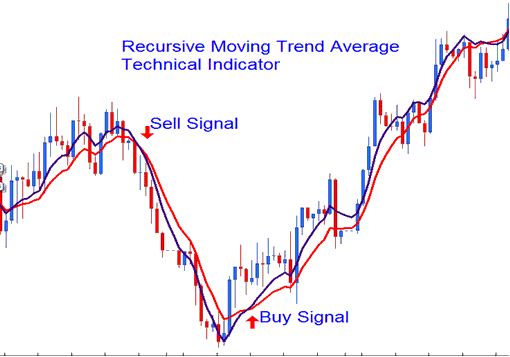
Buy Sell Trading Signal
The Recursive Average looks similar to the traditional moving average, the only difference is that is much smoother due to the technique of calculation that it uses & much less prone to whipsaws.