Commodities Trading Divergence Commodities Trading SETUPS SUMMARY
Classic Bearish - HH commodities price, LH indicator - Indicates underlying weakness of a commodity trend - Warning of a possible change in the commodity trend from up to down.
Classic Bullish - LL commodities price, HL indicator - Indicates underlying weakness of a commodity trend - Warning of a possible change in the commodity trend from down to up.
Hidden Bearish - LH commodities price, HH indicator - Indicates underlying strength of a commodity trend - Mainly found during corrective rallies in a downward commodities trend.
Hidden Bullish - HL commodities price, LL indicator - Indicates underlying strength of a commodity trend - Occurs mainly during corrective declines in an upward commodities trend.
Illustrations of the divergence terms:
M-shapes dealing with Commodity price highs
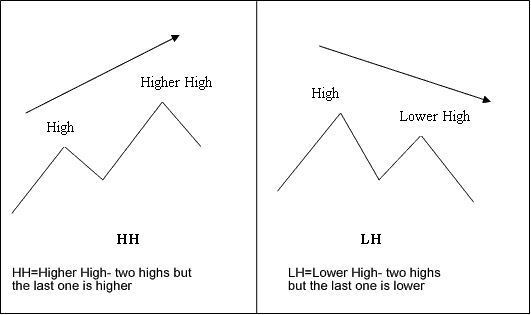
M-shapes
W-shapes dealing with Commodities price lows
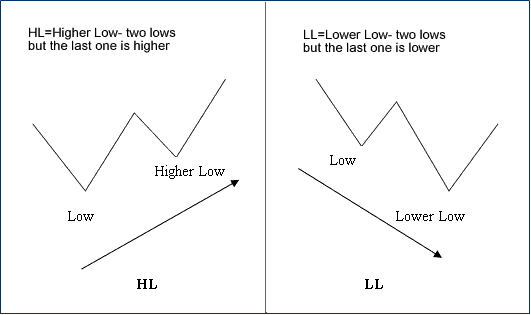
W-shapes
These are the shapes to look for when using these commodity setups.
One of the best indicator for this commodity setup is the MACD Technical Indicator - as a commodities trading signal MACD divergence is a setup to enter a trade. But as with any trading signal there are certain precautions which have to be observed to make this commodity trading signal a setup. Getting straight in to a trade as soon as you see this commodity setup is not the best strategy. This setup should be used in combination with another technical indicator to confirm the direction of the commodities trend. A good system to combine with is the moving average cross over system.
Be aware this commodity setup on a smaller time frame is not so significant. When divergence is seen on a 15 minute chart it may or may not be very important as compared to the 4 hour chart time frame on MT4 commodities software.
If seen on a 60 minute chart, 4 hour chart, or daily chart time frame, then start looking for other factors to indicate when the commodities price may react to the divergence.
This brings us to a key point when using this commodity signal to enter a trade: on a higher time frame MACD divergence can be a fairly reliable indicator of a change in commodities price direction. However, the big question is: WHEN? That is why getting straight in to a trade as soon as you see this commodity setup is not always the best strategy.
Many investors get caught out by entering the commodity market too soon when they see MACD divergence. In many cases, commodities price has still got some momentum to continue in the current direction. The investor who has jumped in too soon can only stare at the screen in dismay as commodities price shoots through his stop-loss taking him out.
If you simply look for this commodity setup without any other considerations you will not be aligning yourself with the best odds, so to increase the odds of making a successful trade you should also look at other factors, specifically other indicators.
What other factors should you consider when using this Commodity setup?
1. Support level, Resistance levels & Commodities Trading Fibonacci levels on higher Commodities Chart Time-frames
Another way to greatly increase the odds of a winning trade is to observe higher chart time-frames before opening an order based on the lower time frames.
If you observe that the hourly, 4 hour or daily Commodity Trading chart has met a major resistance, support or Fibonacci level then probability of a successful trade based on divergence on a lower time frame at this point increases.
2. Reward to Risk Ratio: Commodities Trading Money Management Rules
And finally, when looking for divergence, it is very important that you enter the trade correctly, so that you have a good risk/reward ratio & only open commodity transactions that have more profit potential than what you are risking. If you understand how to enter a transaction properly, you can measure your risk/reward before you open a transaction. That way, you can only choose to open orders which offer a favorable ratio.
Finally, when used correctly & combined with other indicators to confirm this commodity signal, divergence setup can offer huge profit potential.