Rate of Change Commodities Technical Analysis and Rate of Change Trading Signals
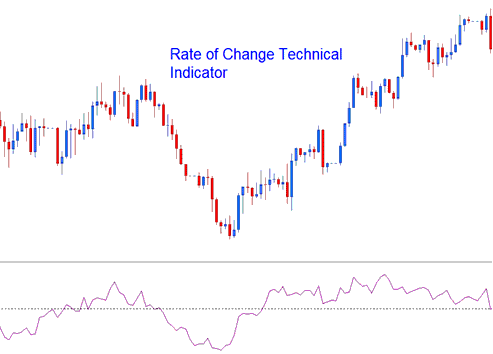
Rate of Change ROC indicator is used to calculate how much commodities price has changed within a specified number of commodities price periods. It calculates the difference between the current candlestick and the commodities price of a chosen number of previous candles.
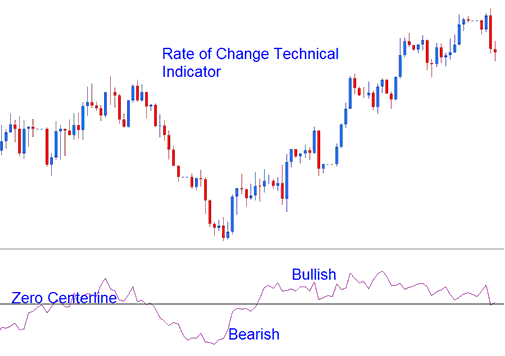
The difference can be calculated using Points or Percents. Rate of Change moves in an oscillation manner, where it oscillates above & below a zero center-line level. Levels above zero are bullish while those below zero center-line level are bearish.
The greater the changes are in the commodities prices the greater the changes in the ROC.
Commodity Technical Analysis & Generating Trading Signals
Rate of Change indicator can be used to generate commodities signals using a number of methods, the most common ones are:
Commodity Trading Crossover Trading Signals
Bullish Signal - buy commodity signal is generated when the ROC crosses above the zero center line
Bearish Signal - sell commodity signal is generated when the Rate of Change crosses below the zero center line.
Oversold/Overbought Levels:
Overbought - The higher the reading the more overbought a commodity instrument is. Values that are above the overbought level imply that a commodities price is overbought and there is a pending commodities price correction
Oversold - The lower the reading the more oversold a commodity instrument is. Values below the oversold level imply that a commodity instrument is oversold and there is a pending commodities price rally.
However, during strong trending markets the commodities price will remain in the Oversold/Overbought Levels for a long time, and rather than the commodities price reversing the commodities price commodity trend will continue for quite some time. It is therefore best to use the crossover signals as the official buy & sell trading signals.
Commodities Trend Line Breaks
Commodities Trend lines can be drawn on ROC indicator just the same way commodity trend lines can be drawn on commodities price charts. Because The Rate of Change is a leading indicator, the commodity trend lines on the indicator will be broken before those on the commodities price charts. A commodity trend-line break on the Rate of Change is an indication of a bullish or bearish reversal commodities trading signal.
- Bearish reversal- Rate of Change readings breaking above a downwards commodity trendline warns of a likely bullish reversal.
- Bearish reversal- Rate of Change readings breaking below an upward commodity trendline warns of a likely bearish reversal.
Divergence Commodity
Rate of Change can be used to trade divergences, and to identify potential commodity trend reversal commodity signals. There are four types of divergences: classic bullish, classic bearish, hidden bullish and hidden bearish divergence.