Trading Price Action 1-2-3 method in the Trade Market
Price action is the use of only charts to trade Energies, without the use of technical chart indicators. When trading with this method, candle charts are used. This strategy uses lines and predetermined patterns such as 1-2-3 pattern that either develops or series of bars.
Traders use this strategy because this analysis is very objective and allows the one to analyze the market moves based on what they see on the charts and market movement analysis alone.
This strategy is used by many traders: even those that use technical indicators also integrate some form of price action in their strategy.
The best use of this method is achieved when the signals generated are combined with line studies so as to provide extra confirmation. These line studies include trend lines, Fib retracement, support and resistance levels.
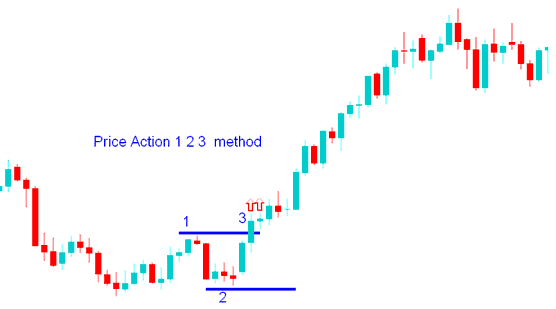
Trading Price Action 1-2-3 Breakout
This strategy uses 3 chart points to determine the break out direction of a energies. The 1-2-3 method uses a peak and a trough, these points forms point 1 and point 2, if market moves above the peak the signal is long, if it moves below the trough the signal is to short. The break out of point 1 or point two forms the third point.
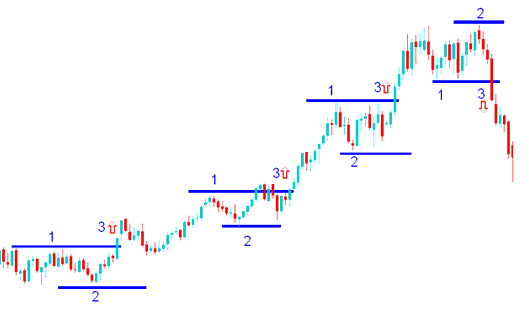
Series of breakouts on Chart

Investors use price action to try and predict where a energies trend direction might go. The market is either trending or ranging.
A trending market moves in a particular direction while a range market moves sideways, normally after hitting a support or resistance level.
Observing the behavior of energies price action provides this information of whether the market is trending or ranging or reversing its direction.
As with any other Energies Trading strategy this method should also be combined with other confirming indicators to avoid whipsaws. The 1-2-3 setup can give good trading signals in a trending market but will give whipsaws when the market is ranging, it's best to determine if the market is trending or not before you start using this strategy.
Combining This Strategy With other Indicators
Good technical indicators to combine with are:
- RSI
- Moving Average Indicator
Investors should use these two indicators to confirm if the direction of breakout is in line with the trend direction shown by these two indicators. If the direction is also the same as those of these indicators then investors can open a trade in the direction of the signal. If not investors should not open a trade as there is more likely a chance that this energies signal may be a energies whipsaw.
Just like any other indicator in Energies, price action also has whipsaws and there a requirement to use this as a combination with other signal as opposed to just using this strategy alone.
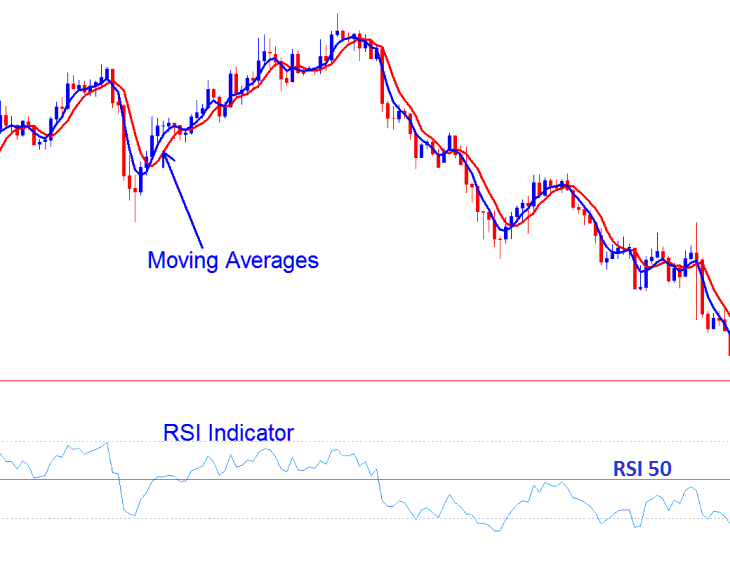
Combining With other Indicators - RSI and Moving Averages
What is a Trading Plan? - Writing a Trading Plan Example
Alternatives: EA Automated Robots or Copier Trading Signals

