Best RSI for 15 Min XAUUSD Chart
How to Add RSI Indicator in MT4
Step 1: Open Navigator Window on XAUUSD Software
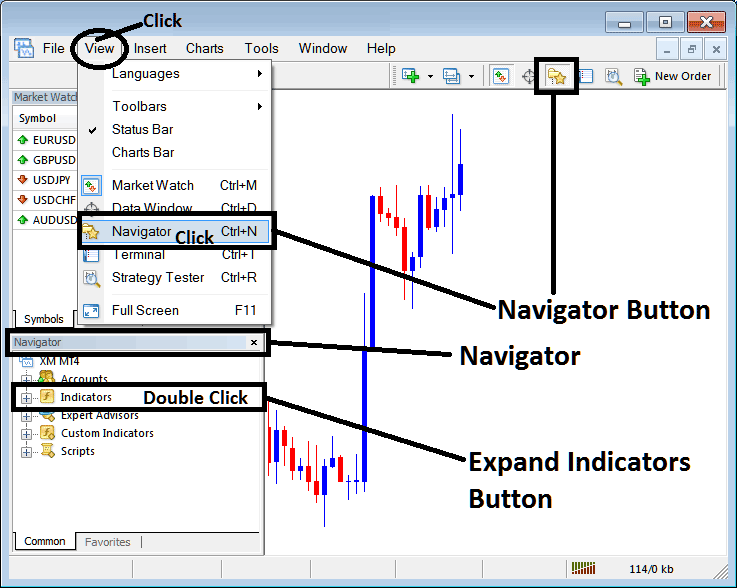
Open Navigator panel window as shown below - Go to 'View' menu (then click it) & then select and choose 'Navigator' panel (press), or From the Standard ToolBar click 'Navigator' button or press the key board shortcut keys 'Ctrl+N'
On Navigator panel, select "Indicators", (DoublePress)
Best RSI for H1 Chart - Best RSI for 1 Minute Gold Chart - Best RSI for 15 Minutes Chart Gold
Step 2: Expand Technical Indicator Menu on the Navigator
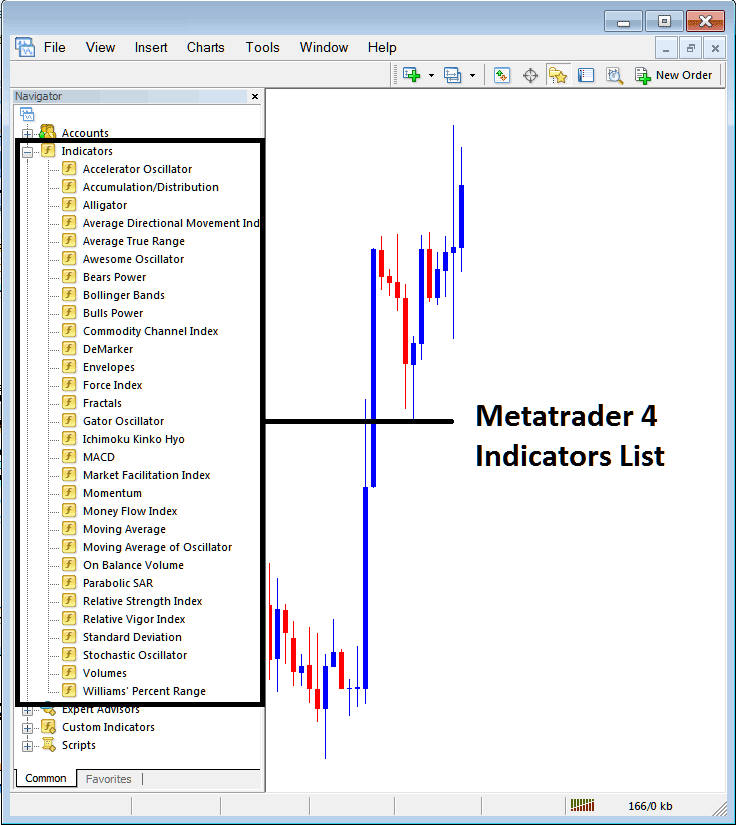
Expand the expand(+) button marker (+) or double click the 'indicators' menu, after this the button will appear and be shown as (-) & will now display a list as shown below - choose the RSI indicator from this list of technical indicators so that to add the RSI indicator onto the chart.
Best RSI for H1 Chart - Best RSI for 1 Minute Gold Chart - Best RSI for 15 Minutes Chart XAUUSD
How to Add Custom RSI Indicator to MT4
If the RSI indicator you want to add is a custom indicator - for example if the RSI indicator you as the trader want to add is a custom indicator you'll need to first add this custom RSI indicator on the MetaTrader 4 platform software and then compile the custom RSI indicator so that as the new added RSI custom indicator shows up on the list of custom technical indicators on the MetaTrader 4 platform software.
To learn how to install RSI on MT4, how to add RSI indicator window to MT4 platform software and how to add RSI custom indicator in MT4 - How to add a custom RSI indicator on MT4.
Gold RSI Indicator
Relative Strength Index Analysis & RSI Signals
RSI is one of most popular indicator & it is a momentum oscillator & a trend following indicator. RSI indicator compares & analyzes a trading price movement magnitude of recent price gains against the magnitude of recent losses price losses & plots this data on a scale of values that ranges between 0-100.
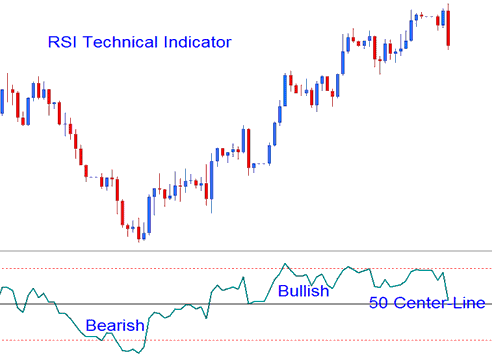
RSI indicator gauges the force of price: indicator readings above RSI 50 center-line mark signify bullish momentum while readings below RSI 50 center-line mark signify bearish energy.
Best RSI for H1 Chart - Best RSI for 1 Minute Gold Chart - Best RSI for 15 Minutes Chart XAUUSD
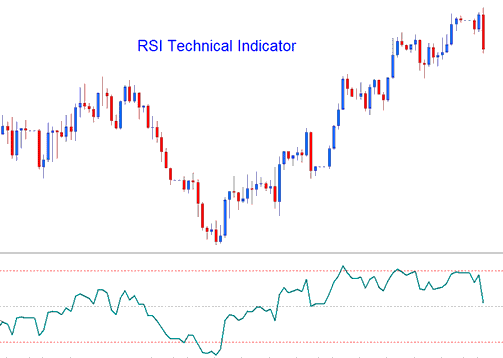
- RSI is drawn as a green-line
- Horizontal dashed lines are drawn to spotting overbought and oversold levels are - RSI 70 & RSI 30 levels respectively.
RSI Analysis & How to Generate Gold RSI Signals
There are different strategies used to trade RSI, these are:
50 center-line Cross over Signals
- Buy Signal - when the RSI indicator crosses above the 50 mark a buy signal is generated.
- Sell Signal - when the RSI crosses below the 50 mark a sell trading signal is generated.
Best RSI for H4 XAUUSD Gold Chart - Best RSI for 5 Minutes XAUUSD Gold Chart - Best RSI Setting for Day Chart Gold
RSI Indicator Trade Setups
Traders can draw trendlines & identify patterns on the RSI indicator. The RSI often forms patterns such as and like head & shoulders pattern which might not have formed clearly on the price chart - but forms on the RSI indicator.
Trading Support & Resistance Gold Price Break-outs
RSI indicator is a leading indicator and can be used to predict Support & Resistance Breakouts before the price breaks its support and resistance zone. RSI uses swing failure gold signal to predict when the price is about to break support and resistance zones.
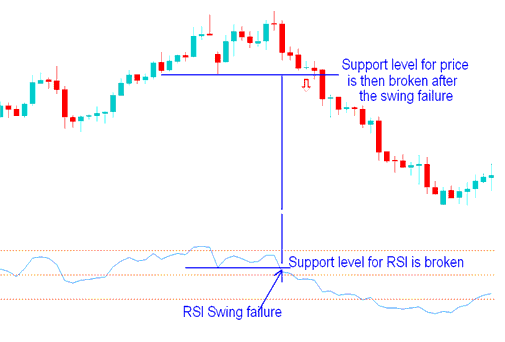
Best RSI for H4 XAUUSD Gold Chart - Best RSI for 5 Minutes Gold Chart - Best RSI Setting for Day Trade Chart XAUUSD
Overbought & Oversold Levels on Indicator
- Over-bought - RSI levels above 80
- Oversold - RSI levels below 20
The Overbought and Oversold levels can be used to generate signals such as and like when RSI turns up from below 20 after oversold is a buy signal - & sell signal is when RSI crosses to below 80 after overbought - RSI sell trade signal.
Divergence RSI Setups
Divergence trading is one of trading analysis strategies used to trade trend reversals of the price trends. There are 4 types of RSI divergences that can be transacted with this RSI indicator explained in the divergence trading lesson on this learn site.
Best RSI for H1 Chart - Best RSI for 1 Minute Gold Chart - Best RSI for 15 Minutes XAUUSD Gold Chart - Best RSI for 5 Minutes XAUUSD Gold Chart - Best RSI Setting for Day Trade Chart Gold
More Topics & Lessons:
- How Does 1:300 XAU/USD Leverage Work?
- Stochastic Oscillator Bullish & Bearish Gold Divergence Setup
- Chart Pattern Explained with Examples
- Best XAU/USD Brokers XAU USD Platforms for Beginners
- Technical Indicator MT4 Gold Trade Software
- Learn Gold Analysis for Beginners
- RSI XAU/USD Strategies for Beginners
- How to Create a XAU USD Plan Using a Written Gold Plan


