Place Heiken Ashi Indicator On Gold Chart in MetaTrader 4 XAUUSD Chart
This Guide will explain how to place Heiken Ashi on a Gold chart on the MT4 platform. For Technical analysis: Technical Analysis of All Indicators .
How to Place XAUUSD Technical Indicators on MT4 Gold Charts
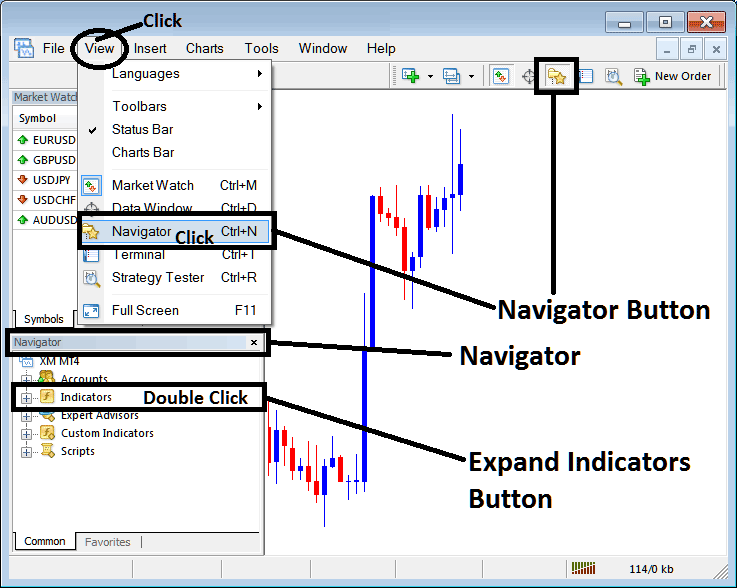
Step 1: Open The Platform Navigator Window
Open the Navigator window panel as shown below - Go to "View" menu (then click it) & then select "Navigator" window panel (click), or From Standard Tool bar click the "Navigator" button key or press keyboard shortcut keys "Ctrl+N"
On Navigator panel, select "Technical Indicators", (Double-Click)
Step 2: Expand the Gold Trading Indicator Menu on the Navigator
Expand the menu by clicking the expand button marker (+) or doubleclick the "indicators" menu, after this the button key will then now appear as (-) & will now be shown as a list as shown below.
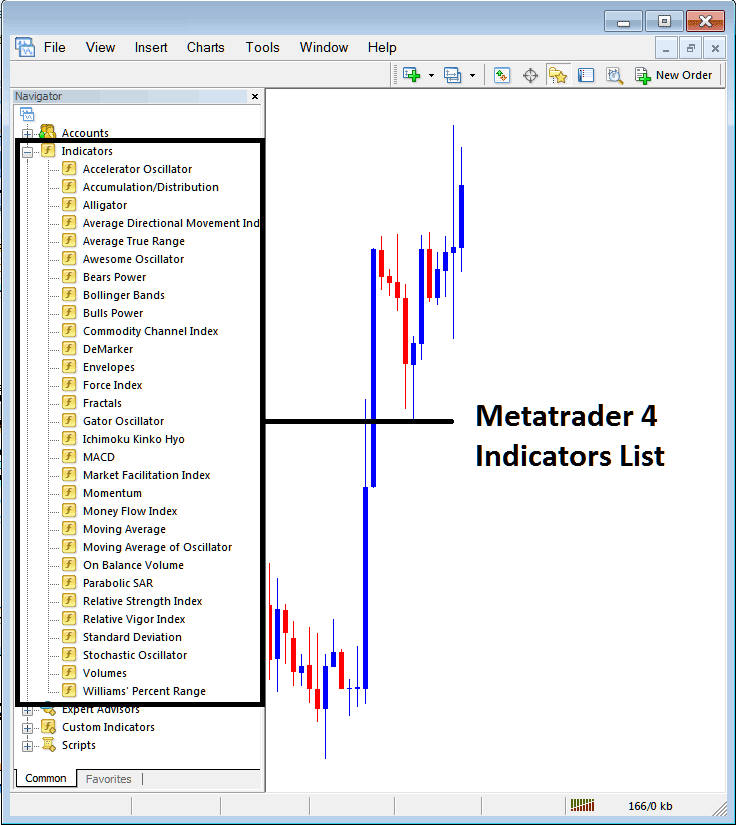
From the Above panel you can then add any technical indicator you want on the xauusd chart.
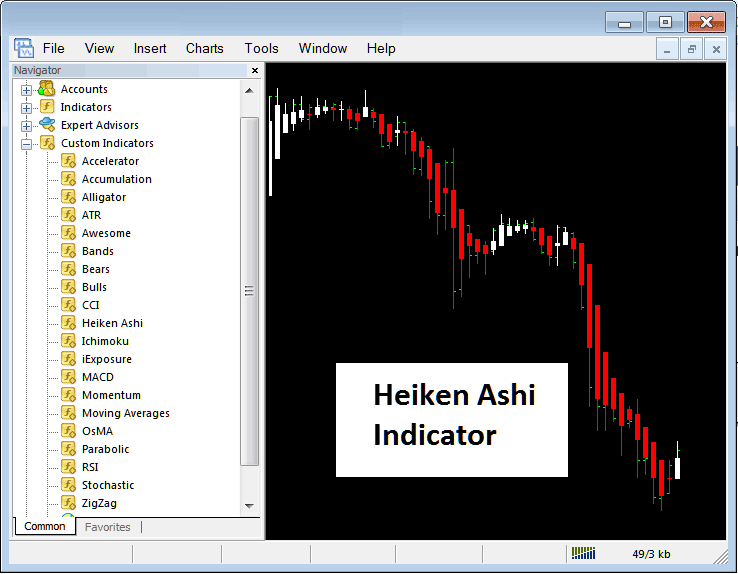
Placing Heiken Ashi on Gold Trading Chart
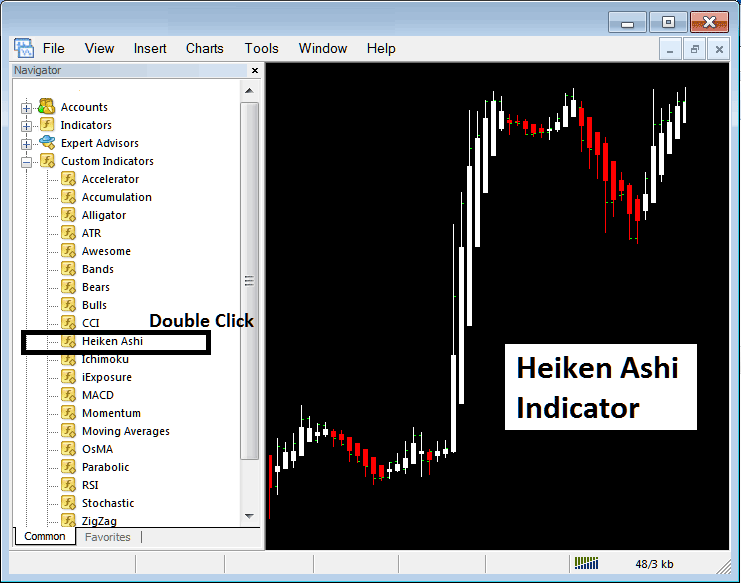
Step 1: Select the Heiken Ashi button on the MT4 list of technical indicators as shown below:

Step 2: Double-click the Heiken Ashi Button Key, & click okay to place the technical indicator on the chart as shown below:
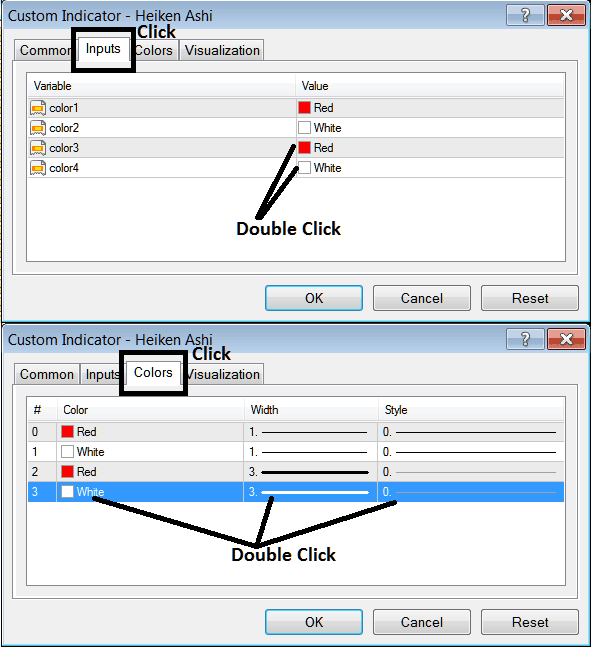
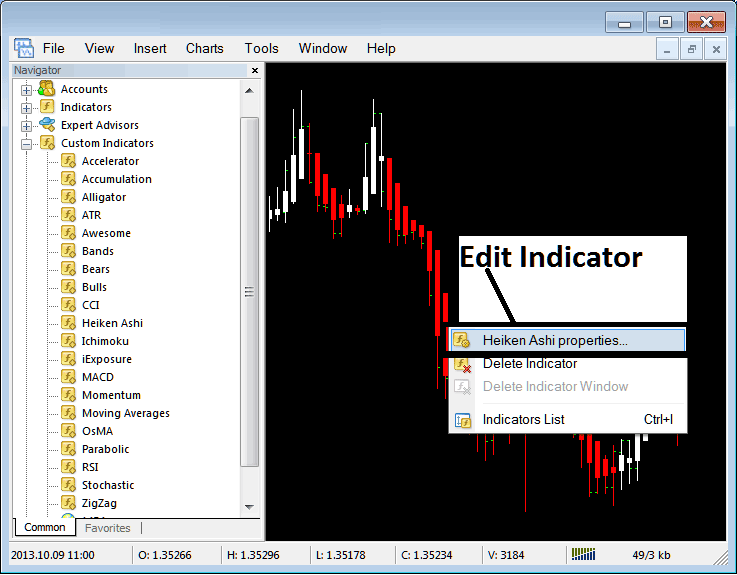
Edit Heiken Ashi XAUUSD Technical Indicator Settings
To Adjust and Change the Setting, right-click in the Heiken Ashi Trading Indicator, select properties setting & then edit the properties of the technical indicator using the popup menu that pops up & then click okay button once you've changed the settings.
The following popup window panel pops up and the Trading Indicator settings can be edited from this pop up window.