XAUUSD Trend Line Break
After xauusd price has moved in a particular direction for an extended period of time within a channel it reaches a point where it stops moving within the channel. When this happens we say that the trend line has been broken.
Since the line is point of support or resistance then we expect the xauusd market to move toward the opposite direction. When this happens traders will close the gold orders which they had bought or sold. This is referred to as taking profit.
Up XAUUSD trend Reversal
When xauusd trading price breaks-out upwards line (support) the xauusd market will then move down
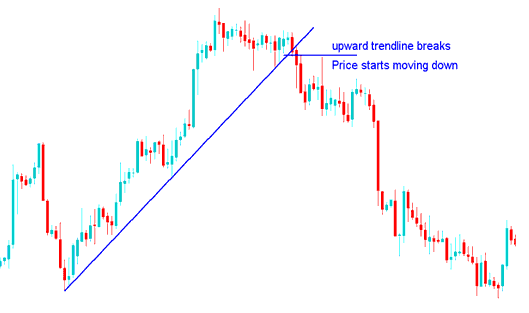
This signal is considered to be confirmed with formation of lower high or lower low. This also provides a trading opportunity to go short once it is broken.
Down XAUUSD trend Reversal
When xauusd trading price breaks downward line (resistance) the xauusd market will then move up
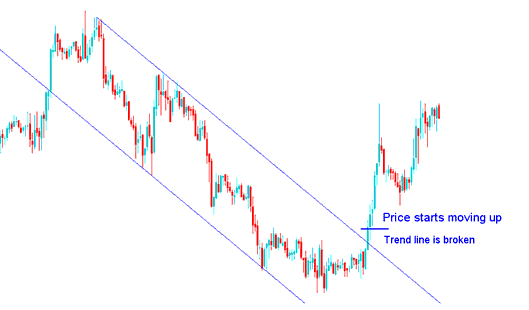
Downward Channel break
This signal is considered to be complete with formation of higher low or higher high. This also provides a trading opportunity to go long once it is broken.
NB: Sometimes when price breaks its gold trend it might first of all consolidate before moving in the opposite direction. Either way it is always good to take profit when the xauusd market direction reverses.
To trade this xauusd trading setup as a trader once you open a new trade in the direction of the trend reversal the xauusd trading price should immediately move in that direction, in a xauusd price break-out manner. This means that the xauusd market should immediately move in that direction without much of a resistance.
If on the other hand the xauusd market does not immediately move in direction of the xauusd trading price breakout then it is best to close out the trade because it means that the gold trend is still holding.
Another tip is to wait for the trend line to be broken & for the xauusd market to close above or below it so as to confirm this xauusd trade signal.
What happens is that most traders open trades waiting for a reversal even before the gold trend is broken, only for the xauusd trading price to touch this line and for the current market direction to hold and gold to continue with the current market direction.
Therefore, when trading this xauusd trading setup it is better to wait until the breakout has been confirmed by xauusd trading price closing above or below the trend line, depending on the direction of the market.
- Upwards Market Direction Reversal - this gold signal is confirmed once the xauusd market closes below this upward line, this should be the correct time to open a sell short trade, so as to avoid a gold trading whipsaw.
- Downwards Market Direction Reversal - this gold signal is confirmed once the xauusd market closes above the downwards line, this should be the correct time to open a buy long trade, so as to avoid a gold trading whipsaw.
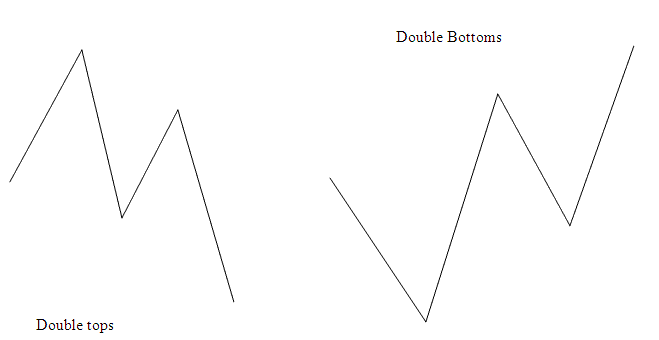
Combining with Double Tops or Double Bottoms Chart Patterns
A good trade set up to combine this xauusd trading setup with is the double tops and double bottoms patterns. Read Double Top & Double Bottom Chart patterns Guide.
This setup should already have formed before the gold trend break signal. Because these double tops and double bottoms are also reversal xauusd trading signals, then combining these 2 setups will give the trader a good probability of avoiding a gold trading whipsaw.
In the above chart screenshots these gold trading setups can be confirmed to have formed even before the reversal xauusd trade signal popped up.
First Example of Upwards Direction Reversal - the Double tops pattern had already formed before gold trend break signal appeared on the xauusd chart.
Second Examples of Downward Direction Reversal - the Double bottoms xauusd trading pattern had already formed before gold trend break signal appeared on the xauusd chart.
Double Top or Double Bottom Combined with other Reversal Trading Signals


