How Can I Tell A Double Bottom Chart Pattern?
Trade Double Bottoms
A double bottom setup is a reversal chart pattern used to analyze when the market direction might reverse & begin moving in the opposite market trend direction.
A double bottom reversal chart pattern forms at the bottom of a downward trend & double bottom chart pattern signals that the downward trend might reverse & start heading in the opposite direction.
To identify a double bottoms chart pattern traders will need to look for two consecutive bottoms that occur after an extended xauusd down-wards trend.
The two consecutive bottoms are what form the pattern known as double bottoms patterns
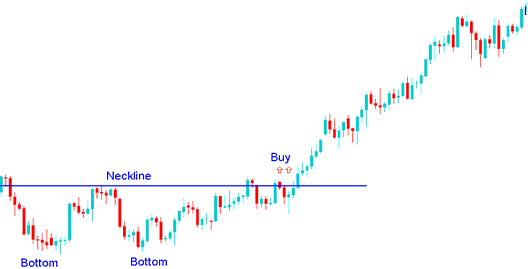
To trade a double bottoms chart pattern traders will wait until the price closes above the neckline of this double bottoms chart pattern & after price closes above the neckline of the double bottoms chart pattern then the reversal signal will be confirmed and traders can open buy xauusd transactions using this double bottoms chart pattern.
Double Bottom Reversal Pattern
Double bottom down trend reversal pattern is a reversal pattern which forms after an extended downward trend. Double bottom down trend reversal chart pattern setup formation is made up of 2 consecutive troughs that are roughly equal, with a moderate peak in between.
Double bottom down trend reversal chart pattern setup is considered complete once the price forms second low & then penetrates highest point between lows, called the neck line. The buy signal from this price bottoming out signal occurs and happens when the price breaks the neck line to the up side.
In XAUUSD, Double bottom down trend reversal chart pattern setup formation setup is an early signal that the bearish trend is ready to reverse.
Double bottom down trend reversal chart setup is only considered confirmed once the neck line is broken. In this double bottoms downtrend reversal pattern setup the neck line is the resistance zone for the price. Once this resistance is breached and broken the price will move upwards.
Summary:
- Double bottom down trend reversal chart pattern setup formation forms after an extended move downwards
- This Double bottoms downwards trend reversal chart pattern reflects that there will be a reversal in the price
- Buy when the price breaks above the neck line: double bottoms reversal pattern.

How Can You Tell a Double Bottoms? - How Can You Tell A Double Bottom Pattern?
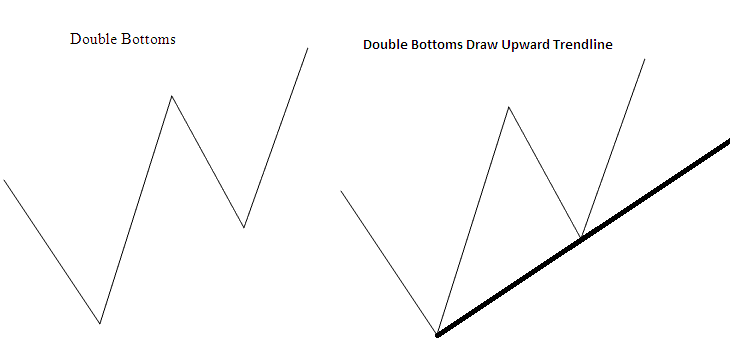
The double bottom reversal pattern looks like a W-Shape, the best reversal signal is where the second bottoms is higher than the first one as is illustrated/shown below, this means the reversal setup can be confirmed by drawing an up-ward trend-line as explained below.

Gold Trade Double Bottoms
How Can You Tell a Double Bottoms? - How Can I Tell A Double Bottom Chart Pattern? - How to Identify Double Bottom Chart Pattern in XAUUSD - How to Trade Double Bottoms
Get More Topics and Lessons:
- Techniques of Scalping Gold, Day Gold, Swing Trading XAUUSD and Position Gold
- How to Add Relative Strength Index, RSI Technical Indicator on Gold Chart
- How Do I Read 61.8% Fibonacci Expansion Level?
- Can you Download MetaTrader 5 in Mac?
- Learn How to Trade Gold & Learn Online Gold Guides
- Gold Price Action Method with Support Resistance Gold Price Action
- Grid, Volume, Auto Scroll and Chart Shift in MT4 Software
- How Do You Trade Ehler Relative Strength Index Trade Indicator?
- Where Can I Study How to Trade on MetaTrader 4 App Explained?
- How to Modify StopLoss Order on MetaTrader 4 Charts


