How Do I Analyze Fibonacci Extension Levels on Gold Charts?
How Do I Read Fibonacci Extension Levels on XAUUSD Charts?
To Calculate Fibo Extension levels on gold charts we use the Fib Extension Indicator
What are the Fibonacci Extension Levels in Gold Trading?
- 61.8% Fibo Extension Level
- 100% Fibonacci Extension Level
We use Fibonacci extension levels to estimate where the price movement will reach. There are 2 important fibonacci extension levels in gold trading; 61.8% and 100% Fibonacci Extension levels, these level are used for taking profit.
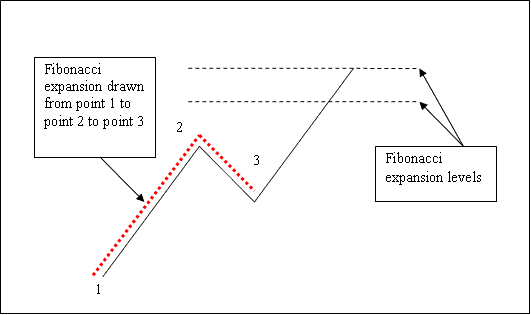
To draw Fibonacci extension levels xauusd technical indicatorwe use 3 chart points.
To draw Fibonacci extension levels on the gold charts we wait until the xauusd price retracement is complete & the price starts to move in original direction of the Gold trend. Where the xauusd price retracement reaches is used as point 3.
The Fibonacci extension indicator example illustrated and explained below shows the 3 Gold Chart Points where the Fibonacci extension indicator is drawn, marked as chart points 1, 2 and 3. Gold Chart point 1 is where the price trend started, Gold Chart point 2 is where the price trend retraced and chart point Marked 3 is where the price retracement reached as shown on the xauusd example illustrated & explained below.
How Do You Interpret Fibonacci Extension Levels on Gold Charts?
The two Fib extension levels 61.8% and 100% Fibonacci Extension levels were then drawn on the gold chart above the Fibonacci Extension Indicator as shown on the Fibonacci extension indicator example above.
How Do You Analyze Fib Extension Levels on Gold Charts?