How Do I Analyze Gold Trend Lines Technical Analysis?
How Do I Read XAUUSD Trend Lines Technical Analysis?
The MetaTrader 4 platform provides gold charting tools for drawing the trend lines in MT4 gold charts. To draw gold trendlines on a gold chart in MT4 platform, xauusd traders can use trend line drawing indicator provided in MetaTrader 4 platform that is shown on the xauusd example illustrated & explained below.
How Do I Draw XAUUSD Trend-Lines and Technical Analysis of XAUUSD Trend Lines in XAUUSD Trading
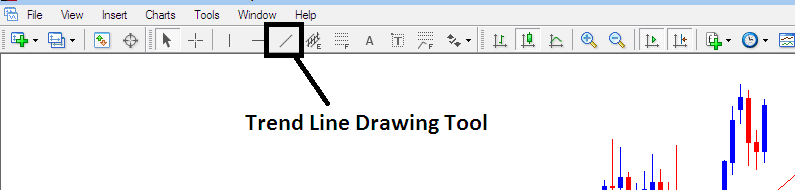
How Do I Draw Gold Trendlines on MT4 - How Do I Draw Gold Trendlines Technical Analysis
To draw gold trendlines on a gold chart - just click the MT4 gold trendline plotting tool above in MT4 technical analysis gold trading software and select point A where you want to start drawing the trendline & then point B where you want the trend line to touch. You can also right click on trend line & on the gold trend line properties option select the option to extend its ray by ticking the "ray check box", if you do not want to extend the trend-line, then uncheck this option in your MetaTrader 4 platform - gold trend line properties. You can also change other gold trend line properties such as color and width on this gold trend line property popup window of the trend line properties. You can download MT4 xauusd trading & learn how to draw gold trend-lines and learn gold trend-line technical analysis with it.
XAUUSD Technical Analysis of XAUUSD Trend Lines with XAUUSD Trading Examples
There are 2 technical analysis techniques used to trade the trend lines:
- Gold Trading Trendline Break
- Gold Trend Line Bounce
How Do I Draw XAUUSD Trend-Lines and Technical Analysis of XAUUSD Trend Lines in Gold Trading?
The gold trendline bounce is a continuation gold signal where the price bounces off the trend line & continues in same direction as that of the xauusd trend.
XAUUSD Trendline Bounce Technical Analysis in Gold Upward Trend
- In an upward gold trend, the xauusd price will bounce upward after hitting this upward trendline level which is the support area.
XAUUSD Upwards Trend - Gold Trend-Line Bounce after Touching The Support Levels Provided by the Upward Gold Trend Line
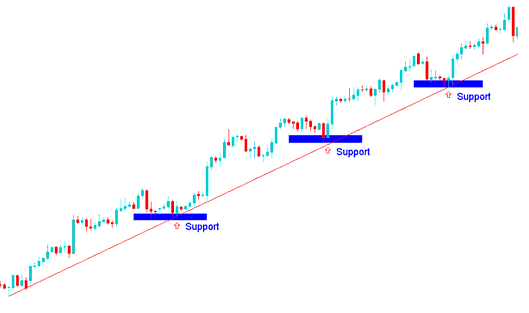
Gold Upwards Trend - Gold Trend Line Bounce Technical Analysis How Do I Draw Gold Trend-Lines and Technical Analysis of Gold Trend Lines in Gold Trading
Gold Trendline Bounce Technical Analysis in Gold Down Trend
- In a downwards gold trend, the xauusd market will bounce downward after hitting this gold trendline level which is the resistance area.
Gold Down Trend - Gold Trendline Bounce after Touching The Resistance Levels Provided by the Downward Gold Trend Line
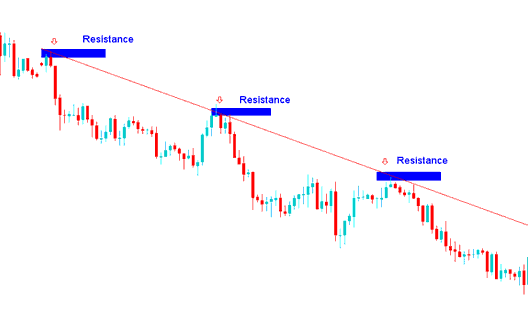
XAUUSD Downward Trend
How Do I Draw XAUUSD Trend-Lines and Technical Analysis of XAUUSD Trend Lines in XAUUSD Trading?
The gold trendline break is a gold reversal trading signal where the xauusd market goes through the trend line & starts heading in the opposite direction.
Gold Trend Line Break Technical Analysis
When a gold up trend-line is broken then sentiment of the gold market reverses & becomes bearish
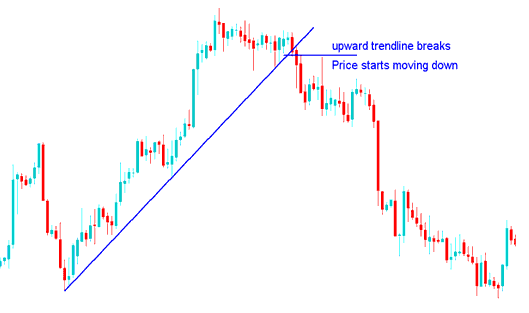
Upwards Gold Trend-Line Break - How Do I Draw Gold Trend-Lines and Technical Analysis of Gold Trend Lines in Gold Trading
Gold Trend Line Break Technical Analysis
When a gold down trend-line is broken then sentiment of the xauusd trading then reverses & becomes bullish
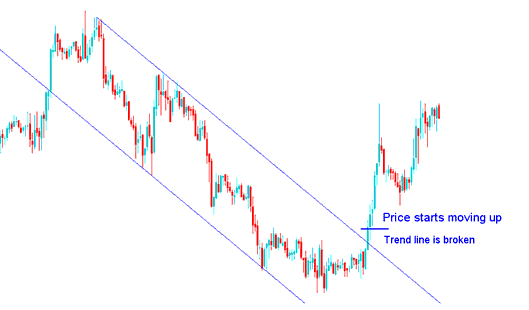
Downwards Gold Trend-Line Break - How Do I Draw Gold Trend-Lines and Technical Analysis of Gold Trend Lines in Gold Trading
NB: for very strong gold trends, after this gold trend-line break reversal signal, xauusd price will consolidate for some time before heading in the opposite trend direction. For short term gold trends then this gold trend-line break reversal signal will mean xauusd price may reverse immediately.
How Do You Analyze Gold Trend Lines Technical Analysis?