Linear Regression Slope Indicator: Analysis and Trading Signal Applications
Linear Regression Slope calculates the slope/gradient value of regression lines which involves the current price bar and the previous n-1 price bar (where n = regression periods)
This Indicator computes and updates this value for each XAUUSD price candle displayed in the price chart.
This indicator comes from the linear regression tool. That tool draws the price chart's trend over a set time period. It uses a linear regression line based on the least squares fit method. The line's slope gets measured next. That slope creates the full linear regression.

Linear Regression Slope
The slope values are then smoothed by multiplying the raw slope indicator values by 100 & then dividing this value by price
Linear Slope Regression = (raw value of the slope * 100 / price).
Smoothing slope values helps in volatile markets with wide gold price ranges per candle. The smoothed slope shows percent change in price for each candlestick in the regression line.
XAU/USD Analysis and Generating Signals
- If the smoothing out of the slope is 0.30, then the regression line is rising and adjusting at a rate of 0.30% for every candle.
- If the smoothing out of the slope of -0.30, then the regression line is going down & adjusting at a rate of -0.30% for every candle.
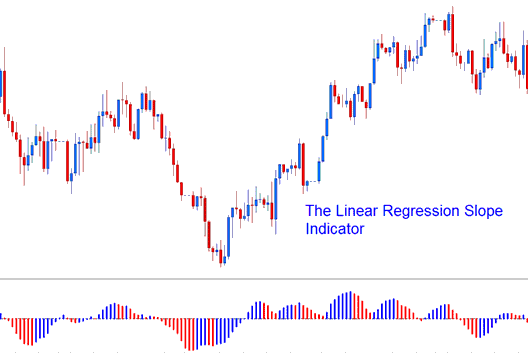
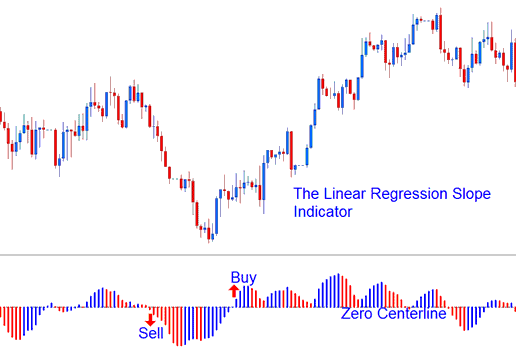
The regression slope is visually presented as a histogram featuring two colors, which fluctuates above and below the horizontal zero centerline. This centerline, crucial for signal generation, is fixed at the 0 mark.
- A rising slope (greater than the previous value of 1 candlestick ago) is displayed in the Blue/Upwards Slope colour,
- A declining slope (lower than the previous value of 1 candlestick ago) is displayed in the Red/Downward Slope color.

Analysis in XAU/USD Trading
More Courses and Topics:
- Determining the Most Favorable Hours for Trading Gold (XAU)
- XAU/USD – How to Approach Technical Trade Analysis
- Analyzing Gold Indicators and Trading Strategies
- Gann Trend Oscillator: Gold Indicator Analysis
- Definition of Gold Divergence
- How to Draw Fibonacci Expansion Levels
- Gold Market Analysis Focusing on Bollinger Band Bulge and Bollinger Band Squeeze Formations
- The Top Educational Platform and Training Course Resources
- How to Introduce a Buy Limit Pending Order Within the MetaTrader 5 Environment.
- Using the T3 Moving Average indicator to get Forex buying signals.

