No Nonsense ADX Analysis
The ADX is a momentum indicator developed by J. Welles Wilder.
ADX is used to determine the power of trends on a scale of 0 - 100: the higher the ADX value the stronger the current trend. It should be noted that while the direction of price is important to the ADX calculation, the ADX isn't a directional technical indicator. ADX trading indicator readings above 30 indicate a very strong trend, while ADX readings below 20 indicate no trend gold market - ranging market.
Traders pair the ADX with other tools as a filter for strategies.
Technical analysis ADX levels turning up from below 20 is an early signal of a new trend while declining levels turning down from ADX levels above 30 as deterioration of the current trend.
ADX is best used as part of a broader strategy that incorporates the +DI and -DI lines. Many platforms bundle these together as part of the DMI Index Indicator system, collectively referred to as the ADX indicator.
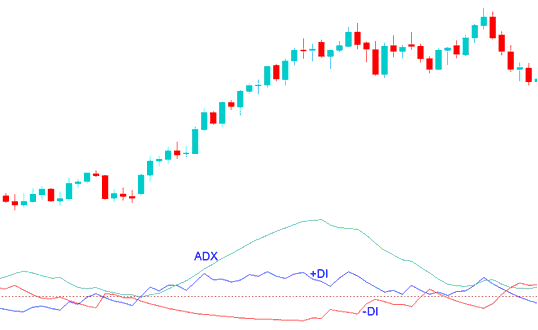
In the illustration depicted and explained:
ADX is the light green-line
+DI is the blue line(bullish line)
- DI is the red line(bearish line)

No Nonsense ADX - No Nonsense ADX Trading Analysis - No Nonsense ADX XAUUSD Strategy
- Bullish Trend - No Nonsense ADX Technical Analysis- when the +DI, blue line is above the -DI, red line
- Bearish Trend - No Nonsense ADX Technical Analysis- when the -DI, red line is above the +DI, blue line
Bullish Signal
A positive signal appears when the +DI line is above the -DI line, meaning the blue line is moving above the red line.
To confirm and identify a robust bullish signal, a gold trader should only proceed when the ADX values exceed 20, and concurrently, the blue line is positioned above the red line. This combination signals a bullish trade setup because the DMI strategy interprets this as a buy signal, while ADX readings above 20 confirm a strong upward momentum in Gold prices.
Bearish Signal
A bearish trading signal gets derived & generated when the red line is above the blue line that's the -DI line is above the +DI line. A strong sell signal will be derived/generated when this bearish trading signal is accompanied by an ADX Indicator value of above 20.
No Nonsense ADX indicator for buy and sell signals explained.
Find more tutorials and topics.
- XAU/USD Define a Trend on XAUUSD Charts
- XAU USD RSI Patterns
- Setting the Bulls Power Indicator for Gold on MT4
- How Do I Trade a Upward Trend on XAUUSD Charts?
- How to Day Trade XAU USD Using Moving Average Indicator Bullish & Bearish XAUUSD Trend Identification
- Divergence Trade Setups Summary XAU USD GOLD TRADING
- Leveraging Economic Data Reports to Track Market Trends in Gold Trading
- What Does a XAUUSD Leverage of 1 500 Mean?
- How to Deal with Different Types of Gold Charts Available
- Learn XAU USD Market for Beginners in Gold

