Analysis Bears Power Sell Signal & Buy Signal
Bears Power How to Read Indicator Buy Signal
Analysis Buy Signal Using Bears Power Indicator
Bears Power is used to Read Sell Signals Only
Bears Power How to Read Indicator Sell Signal
Analysis Sell Signal Using Bears Power Indicator
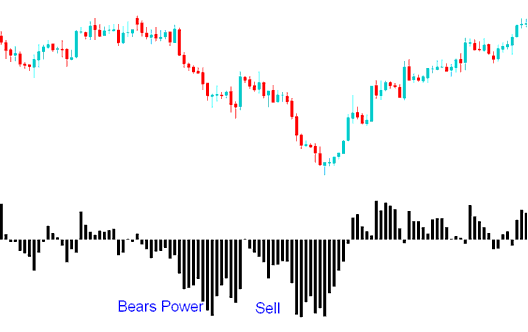
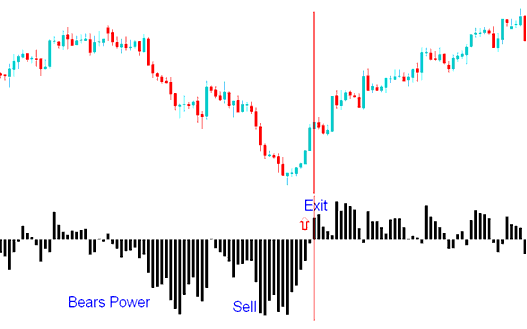
Steps on how to study sell trading signals using Bears Power indicator:
This Bears Power technical indicator sell signal guide explains in detail how to read and study sell trading signals using the Bears Power technical indicator as shown in the trading example below:
Analysis Bears Power Sell Signals
A sell signal gets derived and generated when the Bears Power oscillator moves below Zero line.
The Bears Power technical indicator and Histogram Oscillator Indicator are both below the zero line, showing a downward trend. This means that the LOW is lower than the EMA.
Analysis Bears Power Indicator?
Analysis Bears Power Indicator
If the LOW price crosses above the EMA line, it signals rising prices as histogram bars ascend past the zero mark.
Analysis Bears Power Sell Signal?
The Triple Screen way to use this Bears Power indicator says to find the price direction on a chart with a bigger timeframe (like a day chart) and use the bears power trading signals on a chart with a smaller timeframe (like an hour chart). Trading Signals are done using the smaller chart's timeframe, but only in the same direction as the long-term direction on the bigger chart.
Analysis Sell Signals Using the Bears Power Indicator
Analysis Bears Power Indicator?
Get More Tutorials & Courses:
- Understanding What a XAUUSD Chart Is and Interpreting XAUUSD with a XAUUSD Chart
- Instructions for adding the OBV technical indicator on MT5 gold charts
- Techniques for Forecasting Trend Reversals Based on XAU USD Candle Formations.
- Detailed Explanation of Applying the Fibonacci Retracement Tool within the MetaTrader 4 Trading Software
- Average True Range in Technical Analysis
- Getting the MetaTrader 5 Gold Trading Platform on Your iPad
- What is the Difference if any between Fibonacci Retracement and Expansion?
- Best Gold Trend Reversal Indicator – What Works Now?
- One of the Best XAU USD Broker for Scalping for Expert Advisor(EA) XAU/USD Robots and Expert Advisor Traders

