Choppiness Index Sell and Buy Signals
Choppiness Index How to Read Indicator Buy Signal
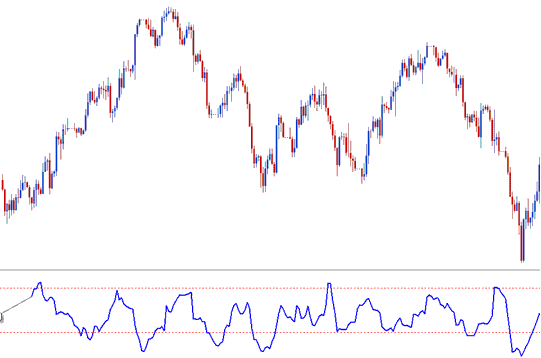
Analysis Buy Signal Using Choppiness Index Indicator
Steps on how to study buy signals using Choppiness Index indicator:
This Choppiness Index buy signal tutorial explains in detail how to read buy signals using the Choppiness Index like as shown in the example below:
Analysis Buy Signals Using Choppiness Index Indicator
Choppiness Index How to Read Indicator Sell Signal
Analysis Sell Signal Using Choppiness Index Indicator
Steps on how to study sell signals using Choppiness Index indicator:
This Choppiness Index sell signal tutorial explains in detail how to read sell trading signals using the Choppiness Index as is shown in the example below:
Analysis Sell Signals Using Choppiness Index Indicator
The Choppiness Index was created to be a simple but useful tool to help gold traders see if prices are trending up or down, or staying in a range.
Choppiness Index works like ADX. It checks trend strength. It tells if price trends or ranges.
Analysis Choppiness Index Indicator?
The Choppiness Index has a range between 0 and 100. The Choppiness Index also usually uses upper and lower ranges at 61.8 and 38.2, respectively.
Choppiness Index is plotted by first calculating the true range for each period and then adding the values of n-periods.
Next, the Choppiness Index figures out the highest and lowest values over a set time and finds their difference.
Thirdly, the Choppiness Index calculates the base-10 logarithm of the total sum of the true ranges observed.
Finally, the Choppiness Index derives its resultant value by dividing the calculated range value by the base-10 logarithm of the 'n-periods' duration, multiplying the outcome by 100.
FX Analysis and Generating Signals
The Choppiness Index is a neutral indicator that does not predict price direction but reflects market movement patterns.
Choppiness Index basic principle is that the more heavily the price is trending over the last number of n-periods the closer to zero the Choppiness Index will be and the more heavily the price is consolidating and is heading sideways in a ranging or choppy manner - over the last n-periods the closer to 100 the Choppiness Index will be.
Choppiness Index readings exceeding 61.8 suggest that the market is currently range-bound or choppy, meaning it is moving sideways and consolidating.
Higher values occur during/after a strong consolidation phase. Higher values could also be interpreted as a signal of a potential upcoming breakout after a significant consolidation has taken place.
Choppiness Index values of below 38.2 indicate that the price is trending.
Lower values on the Choppiness Index typically occur during or following a strong trend, suggesting a potential price consolidation phase and increased market volatility after such a trend.
Analysis Choppiness Index Trade Indicator?
Get More Topics & Courses:
- Guidance on Selecting the Most Suitable XAU USD Trading System
- Steps to Log Into a MetaTrader 4 Trading Account
- How to Locate and Acquire Symbols and Quotes within MetaTrader 4 Trading Software
- How to Open a Live Trading Account: XAU/USD Live Account Opening & Sign Up
- Identifying the Smallest Possible Trade Volume Acceptable for a Mini XAUUSD Account.
- What's the Smallest XAU USD Size for a Cent XAU USD Account?

