Understanding Ichimoku: When to Buy, When to Sell
Ichimoku Kinko Hyo How to Read Indicator Buy Signal
How do you spot a buy signal using the Ichimoku Kinko Hyo Indicator?
Steps on how to study buy signals using Ichimoku Kinko Hyo indicator:
This Ichimoku indicator buy signal tutorial explains in detail how to read buy signals using the Ichimoku indicator as is shown in the example:
Technical Analysis Buy Signals Using the Ichimoku Indicator
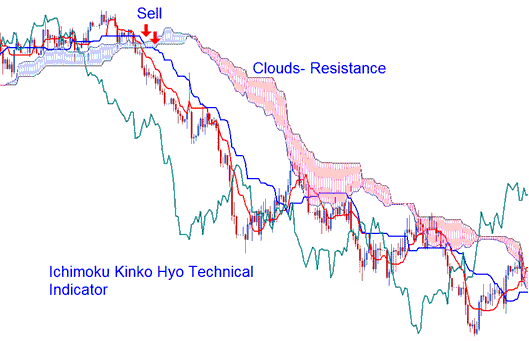
Ichimoku Kinko Hyo How to Read Indicator Sell Signal
Technical Analysis Sell Signals Using the Ichimoku Kinko Hyo Indicator.
Steps on how to study sell signals using Ichimoku Kinko Hyo indicator:
This Ichimoku indicator sell signal guide explains in detail how to read and study sell trading signals using the Ichimoku indicator as shown in the example below:
Technical Analysis Sell Signals Using the Ichimoku Indicator
Technical Analysis Ichimoku Indicator
Bullish buy signal criterion: The Tenkan-Sen crosses above the Kijun-Sen from beneath - Is this an Ichimoku Technical Analysis Buy Signal?
Bearish forex sell signal: Is the Tenkan-Sen line crossing below the Kijun-Sen line, signaling a sell based on Ichimoku Indicator technical analysis?
Nevertheless, the buy and sell trading signals produced exhibit varying levels of efficacy across different areas.
Technical Analysis Ichimoku Indicator?
Bullish cross-over signal occurs and happens above the Kumo (clouds),
Strong buy signal - Technical Analysis Ichimoku Indicator Buy Signal?
Bearish crossover signal occurs and happens below the Kumo (clouds),
Strong sell signal - Technical Analysis Ichimoku Indicator Sell Signal?
If a bullish crossover signal or a bearish crossover signal occurs within the area defined by the Kumo (clouds), this is categorized as a buy signal or a sell signal carrying moderate strength.
If you see a bullish crossover below the clouds, that's a weak buy signal. A bearish crossover above the clouds counts as a weak sell signal.
Technical Analysis Ichimoku Indicator?
Get More Lessons and Topics:
- Detailed Examples and Explanations for Learning Gold Trading Analysis
- Overview of Divergence Trade Setups as Applied to GOLD TRADING
- How to Put Speeding Up Tool on Gold Graph on MetaTrader 4
- Stochastic Momentum Index Indicator for XAU/USD
- Alligator Indicator: Buy Signal in Forex Technical Analysis
- Calculating the value of one standard XAUUSD lot in gold trading.
- How to Add Momentum Trading Indicator on Gold Chart in MetaTrader 4 Software

