Spot Downtrends in Gold Trading Basics
A downward trend in gold trading refers to the sustained movement of prices in a downward direction over a period of time.
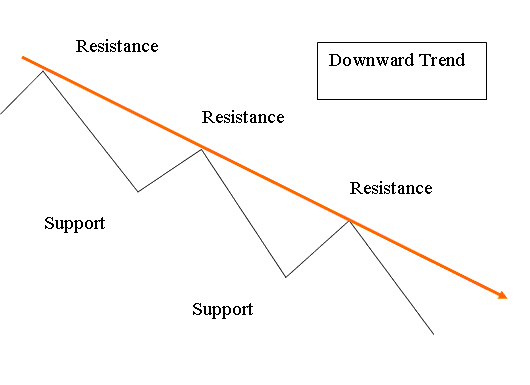
Down Trends can be analyzed using downwards trendlines.
Downward trendline analysis spots the price's drop direction. It links highs in a slope that shows the overall downward path.
A line sloping down marks a downtrend. It's called a downtrend line.
Downward Trend-Line
A downwards trend-line is drawn above setup formed by consecutive lower highs, it must connect at least 2 highs, with the most recent high being lower.
Because prices usually move down in a zigzag pattern, traders often draw a line to show the general downward direction. Traders refer to this general direction as the Gold TREND when analyzing the market. This downward trend-line is drawn on a chart, marking areas of resistance (a bearish trend).

What Defines a Down Trend? Spotting Declines in Gold Trades.
A downward trend occurs when price makes series of lower highs & lower lows. Each gold price high is lower and lesser than prior price high - lower high: LH, & each xauusd gold price low is lower than prior price low - lower low: LL therefore displaying bearish xauusd gold price movement.
In gold's downtrend, lines hold strength each time price hits but bounces off. The down move lasts until highs and lows break higher.
More Guides & Topics:
- Examining Balance of Power XAU/USD Indicator, BOP XAU/USD
- How do gold leverage and margin actually work?
- Aroon Gold Technical Indicator Analysis on Gold Charts
- Various Chart Types for XAU/USD
- Gold PC MacBook MT4 Trading Software
- Tips to Maximize Profit from XAU/USD Systems
- Recommended Book on Gold
- Identification of Bearish Gold Candle
- Understanding Margin Calls in XAU/USD Trading
- Technical Analysis with the Keltner Bands Indicator for Forex Trading Signals

