
Bollinger Bands Oil Technical Analysis & Bollinger Trading Signals
Created by John Bollinger
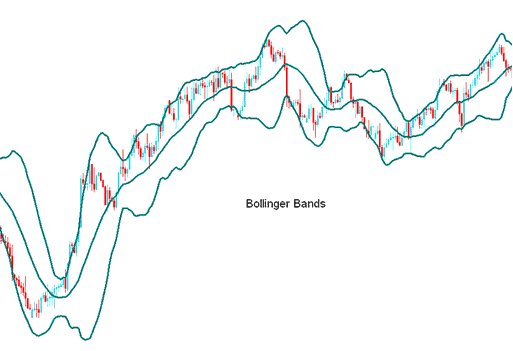
Bollinger bands are formed by 3 lines. Middle line is a Moving Average - 20 period Simple Moving Average.
The bands are then drawn at a distance away from the moving average These are the bands that form the lower & upper lines.
The distance where the bands are drawn is determined by another indicator called the standard deviations. Standard deviation is a measure of volatility in the crude oil market or that of a crude oil.
Since the oil market volatility keeps on changing, the standard deviation will keep varying, and since Bollinger bands are drawn using the standard deviation the distance of the bands will keep on adjusting themselves to the oil market conditions.
When the oil markets become more volatile, the bands widen and they contract during less volatile periods.
The 3 Bands are designed to encompass the majority of a crude oil price action. Middle band forms the basis for the trend, typically a 20-periods simple moving average.
This band also serves as the base for the upper & lower bands. The upper band's and lower band's distance from the middle band is decided by volatility. Upper band is drawn at +2 standard deviationss above the middle band while the lower band is drawn at -2 standard deviationss below the middle band.
Oil Technical Analysis & How to Generate Crude Oil Trading Signals
- Bands provide a relative definition of high & low
- Used to identify periods of high & low volatility
- Used to identify periods when crude oil prices are at extreme regions
the Squeeze
The bands tighten as volatility lessens, this identifies periods of consolidation. Sharp crude oil price break-outs tend to occur after the bands tighten.
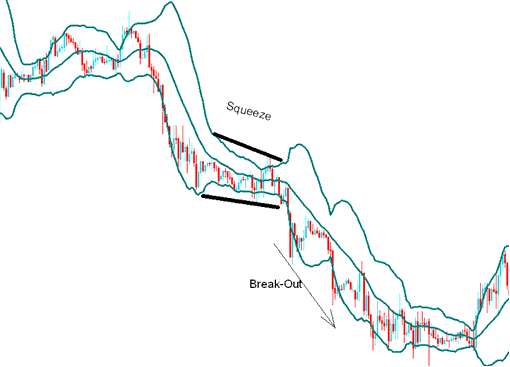
Consolidation Pattern
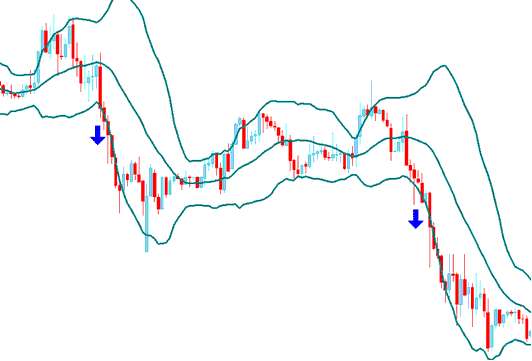
the Bulge
If crude trading prices break through the upper or lower band move outside the bands a continuation of the current oil trend is expected.
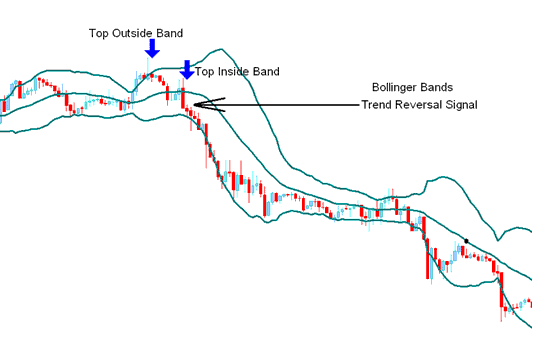
Double Top and Double Bottoms
Bottoms and tops made outside the bands followed by bottoms and tops made inside the bands call for reversals in the trend
The Head Fake - Oil Trading Whipsaw
Traders should be on lookout for false breakouts known as whipsaws or head fakes.
Oil Price often breaks out in one direction immediately following the Squeeze causing many traders to think the break out will continue in that direction, only to quickly reverse & make the true, more significant breakout in opposite direction.
Traders acting quickly on the initial breakout often get caught on the wrong side of the crude oil price action, while those traders expecting a "false break-out" can quickly closeout their original position & enter a trade in the direction of the reversal. It is always good to combine Bollinger bands with other confirmation Indicators.


