
Setting up Oil Trading Fib Expansion in MetaTrader 4 and Changing its Settings
The steps below explain how to draw these levels, how to use this tool and how to change its settings.
How to Add This Tool in MetaTrader 4 Platform
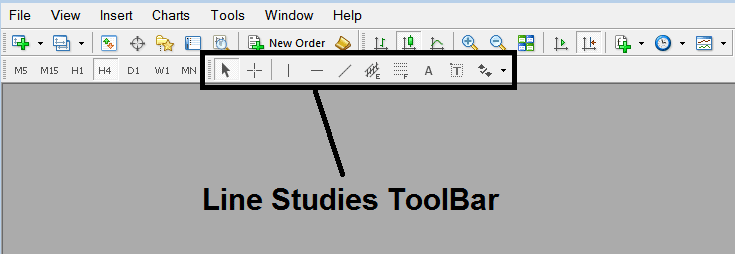
Steps: This tool is not shown by default on MetaTrader 4 settings, if the button isn't shown on your MT4 software, (no need to download this indicator) then find "MetaTrader 4 Line Studies Tool-bar" shown below and follow steps below:
1. MT4 Line Studies Tool-Bar
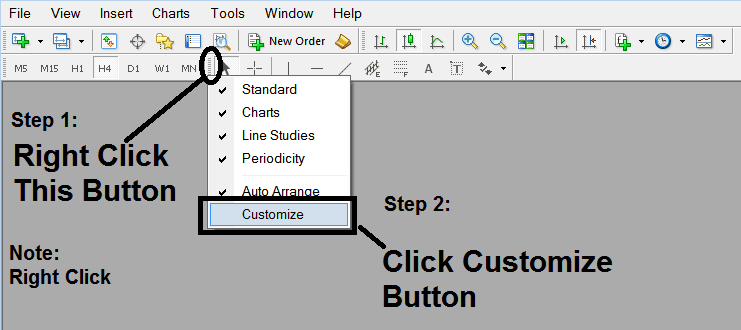
2. Customize Line Studies Toolbar
Rightclick Customize button key (illustrated below) >>> A dropdown menu appears, Choose Customize >>>
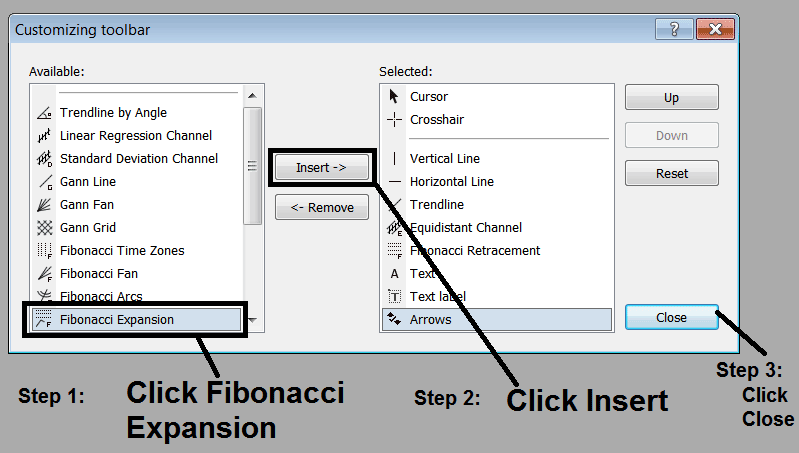
3. Place This Tool in MT4 Software
Choose the expansion tool from the pop up panel that will then appear >>> Click Insert button >>> Click Close. (Shown Below)
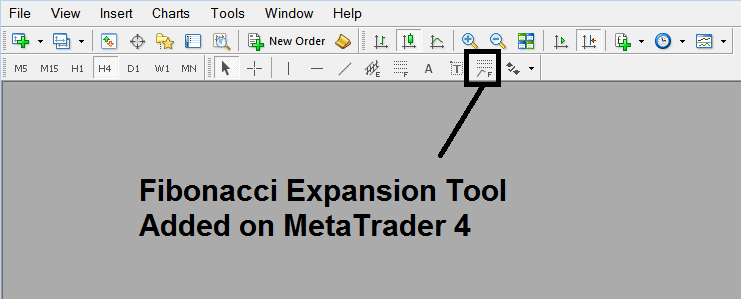
4. Oil Fibonacci Expansion Tool Added
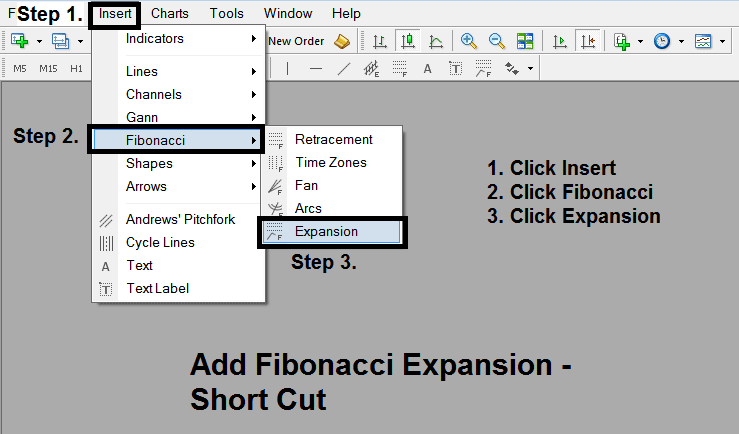
Short Cut of How to Add
You can also use this short cut instead of the above method, do this:
- Click "Insert Menu"
- Click Fibonacci
- Click Expansion
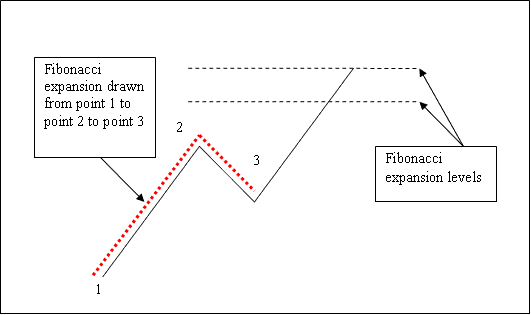
Steps on How to Draw Expansion
Steps. Once you have added this button, you can draw this tool by selecting it and drawing it on a oil chart. Three points will be marked 1, 2 and 3, choose the Fibonacci indicator, place the indicator on point 1 & while still holding down the mouse button key drag the mouse up to point marked 2.
How to Adjust This Tool on a Chart
Steps. Once you have drawn this indicator, you might need to move one point or another to the exact position where you precisely want. These 3 points are marked 1, 2 & 3 and these are used to change the settings after this indicator has been drawn on a Oil chart.
To change the settings: do this, doubleclick the indicator, it pops up as dotted lines (shown above), three cursor points appear that are marked 1 2 3, you can then use these Three points to adjust & fit the indicator accordingly to your chart (just click on the point you want & move it).


