
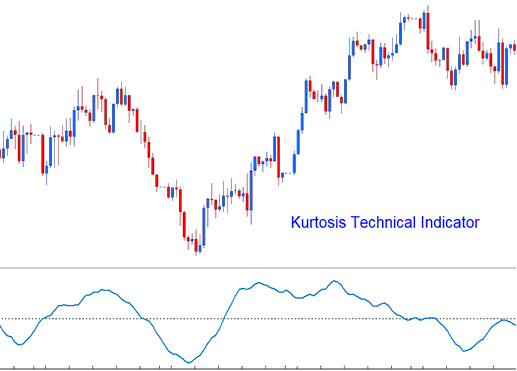
Kurtosis Oil Technical Analysis and Kurtosis Trading Signals
This oil indicator is used to help determine the sentiment of the crude trading market.
It is calculated in 3 parts.
- Kurtosis portion
- Fast Kurtosis
- Fast/Slow Kurtosis
The Kurtosis portion is calculated using the formula:
K = n-periods momentum - n-periods momentum of 1 bar before (current crude oil price bar's momentum value minus the previous crude oil price bar's momentum value)
The Fast Kurtosis portion is calculated using the formula:
FK = n-periods moving average of K
Fast/Slow Kurtosis portion is calculated using the formula:
FSK = n-periods moving average of FK
Oil Technical Analysis & How to Generate Oil Trading Signals
Bullish Signal - A buy oil signal is generated when the indicator crosses above zero.
Bearish Signal - A sell oil signal is generated when the indicator crosses below zero.

Technical Analysis in Oil Trading


