
Bollinger Bands Oil Trading Price Action in Trending Oil Trading Markets
Bollinger Bands indicator is used to identify and analyze trending oil markets. In a trending oil market this oil technical indicator clearly shows up or down direction.
Bollinger Bands indicator can be used to determine the direction of the Oil trend. In an upward oil trend Bollinger Bands indicator will clearly show the direction of the oil trend, it will be heading upwards and crude oil price will be above middle Bollinger.
In a downwards oil trend the crude oil price will be below the middle band the bands will be heading downwards.
By observing the Bollinger bands oil indicator patterns formed by Bollinger bands a trader can determine the direction in which the oil market is likely to move.
Bollinger Bands Oil Technical Indicator Patterns and Continuation Trading Signals
Oil Upwards Trend
- During an upswing, the oil candles will stay within the upper Bollinger band the central moving average.
- Oil Prices that close above the upper band are a sign of bullish continuation oil signal.
- Oil Prices can hug/ride the upper band during an upward oil trend
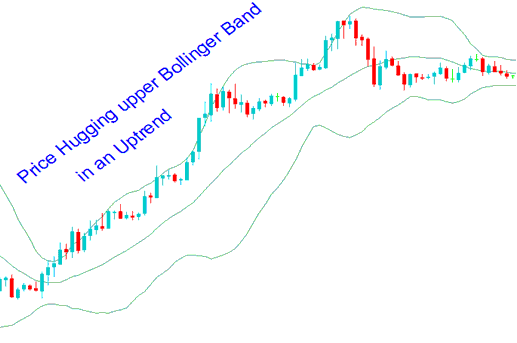
Upward Oil Trend Strategy Using Bollinger Bands Strategy
Crude Oil Downwards Trend
- During a down swing, the oil candlesticks will stay within the moving average and the lower band.
- Oil Prices that close below the lower band are a sign of bearish continuation oil signal.
- Oil Prices can hug/ride the lower band during an downwards oil trend
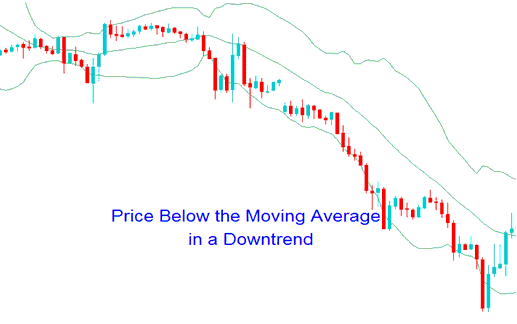
Downwards Oil Trend Strategy Using Bollinger Bands Strategy


