
Stochastic Oil Indicator Overbought and Oversold Levels
Stochastic oscillator oil indicator is used to look for overbought/oversold oil signals. Overbought levels are above 80% level and oversold levels are below 20% level.
Key is to not only look at Stochastic oscillator oil indicator when the %K or %D lines touch or cross overbought/oversold, but also when they cross over and back through these levels.
Just as with other oil momentum indicators such as RSI indicator the Stochastic oscillator oil indicator can stay inside the overbought and oversold levels for some time. When this oil stochastic oscillator indicator stays within these levels for a long time it indicates strong upward oil trend (overbought) or strong downwards oil trend (oversold).
When the stochastic lines cross back below or above these overbought & oversold levels it's usually a good indication of an upcoming oil trend reversal.
A trader can look for further oil signals to make the oversold or overbought levels more reliable if:
Buy Oil Signal Using Stochastic Oscillator Oversold Levels
- Before Buying, the %K & %D lines turn upward from below 5%.
- A reading that is floating near 5% means that oil bears are in control and there is selling of the crude oil. A trader should wait for the Stochastic Oscillator to move back above 5% as a sign that the selling pressure is easing.
The Buy oil signal is confirmed when the stochastic oscillator oil indicator moves above oversold, then after a while returns to oversold but this time moves up immediately without staying at the overbought.
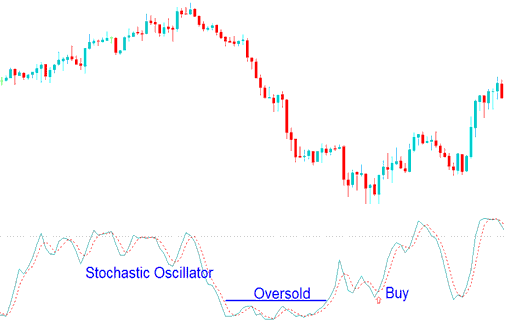
Buy Oil Signal Using Stochastic Oscillator Oversold Levels
Sell Oil Signal Using Stochastic Oscillator Over-bought Levels
- Before Selling, the %K & %D lines turn down from above 95%.
- A reading that is floating above 95% means that oil bulls are in control and there is buying of the crude oil. A trader should wait for the Stochastic to move below 95% as a sign that the buying pressure is easing.
- The sell oil signal is confirmed when the stochastic moves below overbought, then after a while returns to overbought but this times moves down immediately without staying at the overbought.
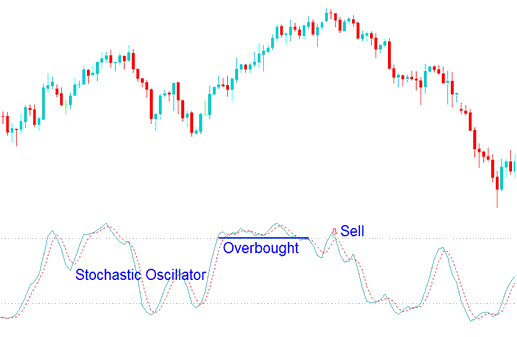
Sell Oil Signal Using Stochastic Oscillator Over-bought Levels
Looking at different chart time frames when using oversold and overbought levels can also help to determine the correct entry strategy when opening a crude oil trade.
The main theory is to trade with the crude oil trend. Always double check the oil signals with the longer term stochastic oscillator indicators to confirm oil signals on the shorter oil chart time frame periods.


