Ichimoku Indicator
Ichimoku came from a Japanese chart method. A newspaper writer with the name Ichimoku Sanjin developed it.
- Ichimoku means: 'a glance' or 'a look'
- Kinko meaning 'equilibrium' or 'balance'
- Hyo is the Japanese word/term for "chart"
Therefore, Ichimoku translates to ‘a glance at an equilibrium chart'. The Ichimoku technique aims to ascertain the probable market direction and assists traders in determining the ideal timing for entering or exiting market positions.
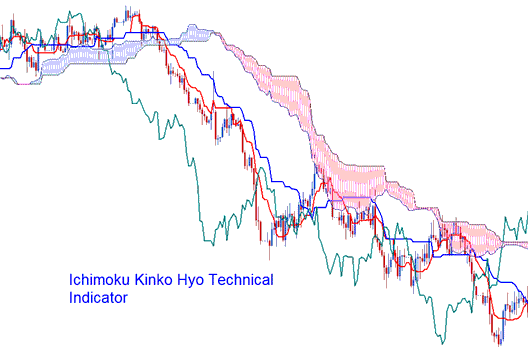
Calculation
This signal shows five lines, and they are made using the center points between earlier highest and lowest prices. The five lines have the following calculations:
1) Tenkan-Sen: The Conversion Line: Red Line (Highest High + Lowest Low) / 2, for last 9 price periods
2) Kijun-Sen: Base Line: Blue Line (Highest High + Lowest Low) / 2, for last 26 price bars periods
3) Chikou Span: Lagging Span: Green Colored Line Today's closing price drawn 26 price periods behind
4) Senkou Span A: Leading Span A = (Tenkan Sen + Kijun Sen) / 2, drawn 26 price bars periods ahead
5) Senkou Span-B: Leading Span B: (Highest High + Lowest Low) /2, for the past 52 price bars periods, drawn 26 price periods ahead
Kumo: Cloud: area between Senkou Span A and B
Technical Analysis and Generating Trade Signals
Bullish trading signal - Tenkan-Sen crosses the Kijun-Sen from below.
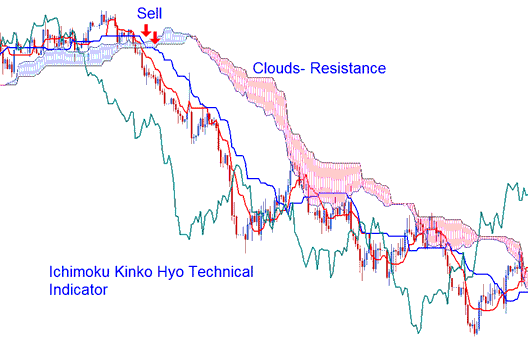
Bearish trading signal - Tenkan-Sen crosses Kijun-Sen from above.
Nevertheless, the buy and sell signals generated by this stock tool exhibit varying levels of inherent strength across different price zones.
Technical Analysis in Indices Trade
Bullish cross-over signal forms above the Kumo (clouds),
Strong buy signal.
Bearish cross-over signal forms below Kumo (clouds),
Strong sell signal.
If a bullish/ bearish cross-over trading signal takes place within the Kumo (clouds) it's considered a medium strength buy or sell signal.
A bullish crossover that occurs below the clouds is considered a weak buy signal while a bearish crossover that occurs above the clouds is considered a weak sell signal.
Support & Resistance Zones
Areas of support and resistance can be anticipated based on the existence of Kumo (clouds). Additionally, the Kumo can help determine the prevailing market trend.
- If price is above the Kumo, current trend is said to be upward.
- If the price is below the Kumo, current market trend is said to be downward.
The Chikou Span, also known as the Lagging Span, is utilized to assess the underlying underlying strength supporting the buy or sell indication.
- If the Chikou Span indicator is below the closing price of the last 26 periods ago and a sell short signal is given/generated, then the strength of the market trend is downward, otherwise the signal is considered to be a weak sell signal.
- If there is a bullish signal & the Chikou Span is above price of the last 26 periods ago, then the strength of the market trend is to the up-side, otherwise it's considered to be a weak buy signal.
More Tutorials and Topics:
- How Do I Trade SPAIN35 on MT5 Platform?
- How Can I Trade MT5 Fib Pullback Indices Indicator?
- How Do You Analyze MT4 Downward Indices Trend-line in MT4 Software Platform?
- Index MT5 Introduction to MetaTrader 5 Interface
- Index MT4 Terminal Window Panel
- Stock Index Strategies
- TSI Index Indicator Analysis
- RSI Index Classic Bullish Divergence & Indices Classic Bearish Trading Divergence
- Index Info
- How to Add a Stock Index Order on MetaTrader 5 Mobile Indices App
