Stochastic System
This lesson mixes Stochastics with other tools. But calling it the Stochastic System has a nice ring.
Stochastics Indicator can be combined with other indicators to form a system. For our examples we will combine it together with:
- RSI
- MACD
- MAs Moving Averages Index Technical Indicator
Example 1: Stochastic Indicator Trading System
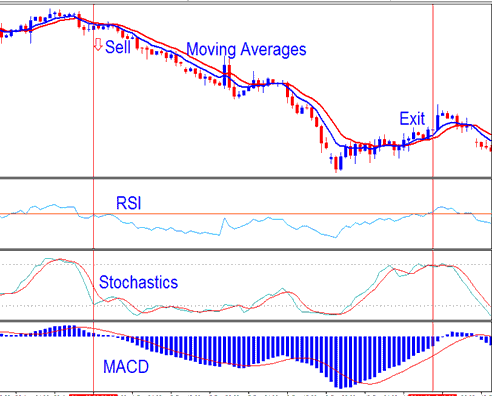
Sell Indices Signal Generated using Stochastic Indicator System
From our trade system the sell stock signal is derived and generated when:
- Both Moving Averages are moving down
- RSI is below 50
- Stochastic heading downwards
- MACD heading downward below centerline
The sell stock signal appeared when all the index rules were followed. The exit stock signal is found and made when a trade signal goes in the opposite direction, which is when indicators change direction.
Good thing about using such a stock strategy is that we're using different types of technical indicators to confirm the trade signals & avoid as many whipsaws as possible in process.
- Stochastic - is a momentum oscillator technical indicator
- RSI- is a momentum oscillator technical indicator
- MAs Moving Averages Indicator- is a market trend following indicator
- MACD- is a market trend following trading indicator
It's very helpful to combine more than one stock indices trading indicator, as a combination of signals is much better than relying on one single technical indicator. The stock indicator combinations re-inforce each other signal, & cancel out false whipsaw stock signals.
A trend indicator gives stock index traders the big view. Pair it with momentum tools. They create solid entry and exit points for indices.
The stock indicators combinations & their signals help to decipher a lot of the stock trading market activity.
Example 2: Stochastic Indicator Trading System
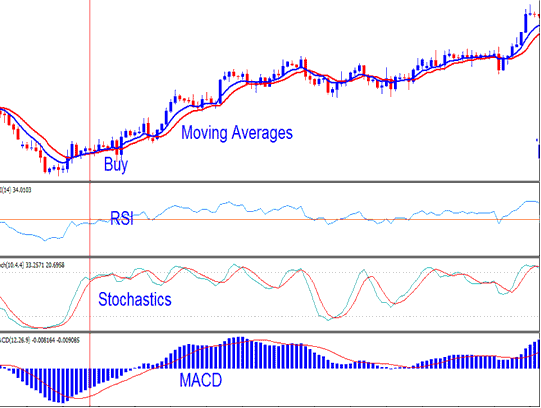
Buy Indices Signal Generated using Indices Stochastic System
In this situation, the market is clearly going up, but there were some times when the stochastic oscillator indicator stock indicator quickly changed direction: can you find them? - So, how can a trader avoid trading when the market quickly changes direction?
By examining additional indicators such as the MACD, traders can potentially avoid false signals. For example, although the MACD indicator was near the zero centerline, it did not generate a crossover signal. Additionally, the gradient of the moving averages was not steep enough to indicate a defined market trend reversal. Well the thing is that it’s not so obvious when it comes to recognizing stock market whipsaws: it's a skill which takes some time to master but after some time you can identify whipsaws from a mile away.
A helpful piece of advice is that when the MACD indicator remains above the zero center line, even if the MACD lines are declining, the trend still shows an upward direction. As illustrated in the example provided earlier, the MACD indicator consistently stayed above the zero line, and subsequently, the upward trend persisted with the MACD technical indicator remaining above that zero line and continuing its ascent.
When the stock market is moving up and down without a clear direction, the Stochastic Oscillator will give signals very quickly, but these signals can often be wrong. That is why it is better to use the Stochastic Oscillator with other indicators, and only trade when the signals are also confirmed by one or two other indicators.
Get More Tutorials & Lessons:
- SX 5E Stock Index Strategy How to Develop Stock Index Strategy for SX 5E Training Course
- Index Trade DowJones in FX
- How Can I Open Stock Index Chart on MT4 Platform?
- How to Place Alligator Index Trade Indicator on Trading Chart on MT4 Software Platform
- How to Draw Upward & Downward Indices Trend-line in MetaTrader 4 Chart
- What are Index in Trading?
