ADX Stock Analysis & ADX Trading Signals
Created by J. Welles Wilder
This a momentum indicator used to determine the strength of a stock price trend: it is derived from the DMI - Directional Movement Index which has two lines.
+DI - Positive Directional Movement Index
-DI - Negative Directional Movement Index
ADX is calculated by subtracting these two values and applying a smoothing function.
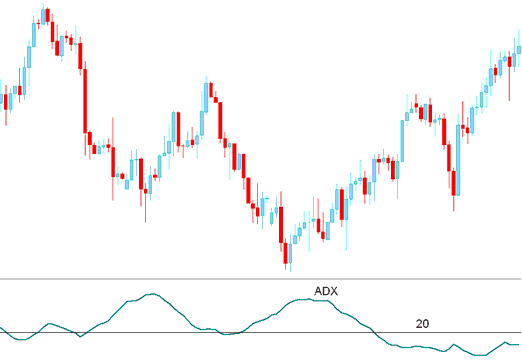
The ADX is not a directional technical indicator but a measure of the strength of the stock trend which has a scale of Zero to 100.
Higher the technical indicator value the stronger the trend.
A value of below 20 indicates that the stocks market is not trending but moving in a range.
A value of above 20 confirms a buy or sell stock signal & indicates a new stock trend is emerging.
Values above 30 indicates a strong trending market.
When ADX indicator turns down from above 30, it indicates that the current stock trend is losing momentum.
Directional Movement Index Technical Indicator
Since the ADX alone is a directionless indicator it is combined with the DMI index to determine the direction of stock.
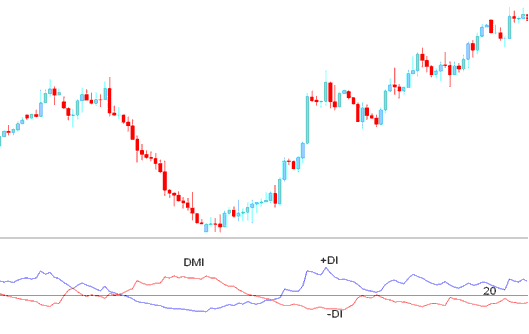
DMI
ADX and DMI Index
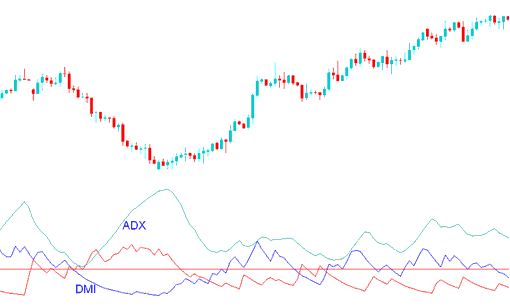
When the ADX is combined with DMI index a trader can determine the direction of the stock trend and then use the this indicator to determine the momentum of the prevailing stock trend direction.
Stock Analysis and How to Generate Trading Signals
Buy Trading Signal
A buy stock signal is generated when the +DI is above -DI, and the ADX technical indicator is above 20
The Exit signal is generated when technical indicator turns down from above 30.

Buy Trading Signal
Sell Trading Signal
A short signal is generated when the -DI is above +DI, and the ADX technical indicator is above 20
The Exit signal is generated when technical indicator turns down from above 30.
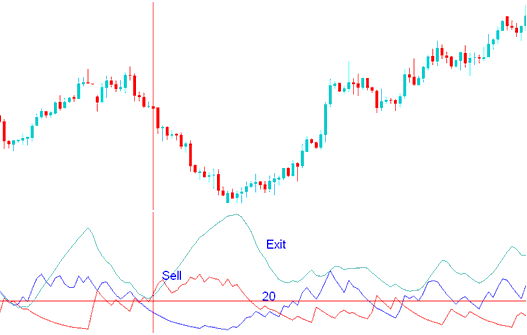
Sell Trading Signal


