Momentum Stock Analysis & Momentum Oscillator Trading Signals
The momentum technical indicator uses mathematical equations to calculate line of plotting. Momentum measures velocity with which stocks price changes. This is calculated as a difference between the current stocks price candle and the average stocks price of a chosen number of stocks price bars ago.
Momentum represents the rate of change of the stocks price over those specified time periods. The faster that stock prices rises, the bigger the increase in momentum. The faster that stocks prices decline, the bigger the decrease in momentum.
As the stocks price movement starts to slowdown the momentum will also slowdown and return to a median level.
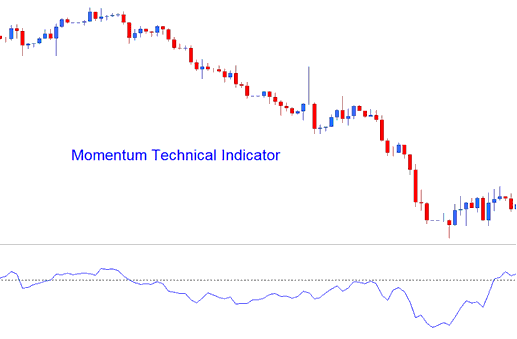
Momentum
Stock Trading Analysis & Generating Trading Signals
This stock indicator is used to generate technical buy and sell stocks signals. The three most common methods of generating trading signals used in stock trading are:
Zero Centerline Stock Trading Crossovers Stocks Trading Signals:
- A buy stock signal is generated when Momentum crosses above zero
- A sell stock signal is generated when Momentum crosses below zero
Overbought/Oversold Levels:
Momentum is used as an overbought/oversold indicator, to identify potential overbought and oversold levels based on previous readings: the previous high or low of the momentum is used to determine the overbought & oversold levels.
- Readings above the overbought level mean stock is overbought and a stock trading price correction is pending
- While readings below the over sold level the stocks price is oversold & a stock price rally is pending.
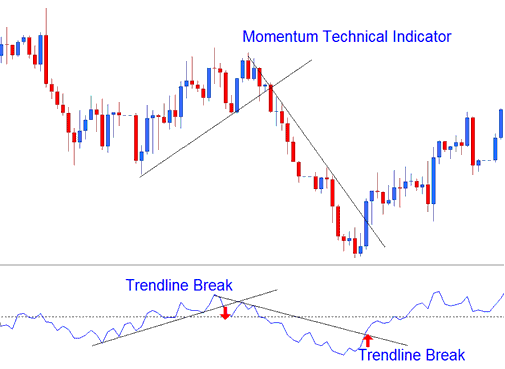
Stock Trend Line Break-outs:
Stock Trend lines can be drawn on the Momentum indicator connecting the peaks and troughs. Momentum begins to turn before stocks price therefore making it a leading indicator.
- Bullish reversal - Momentum readings breaking above a downwards stock trendline warns of a possible bullish reversal stock signal while
- Bearish reversal - momentum readings breaking below an upward stock trend line warns of a possible bearish reversal stock trade signal.
Technical Analysis in Stock Trading


