Relative Strength Index Stock Analysis & RSI Trading Signals
Created by J. Welles Wilder, described in the book "New Concepts in Technical Trading Systems".
RSI is the most popular indicator & it is a momentum oscillator and a stock trend following indicator. RSI compares a stock price magnitude of the recent stocks price gains against its magnitude of recent losses stocks price losses & plots this data on a scale of values which ranges between 0-100.
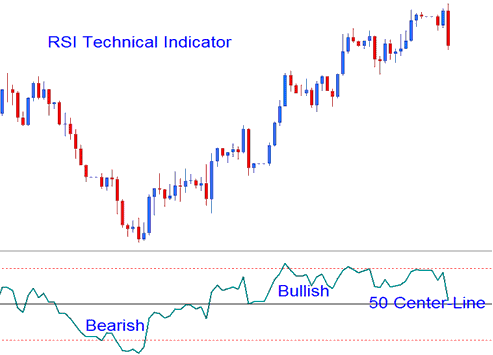
RSI measures the momentum of stock; values above 50 signify bullish momentum while values below 50 center-line signify bearish momentum.
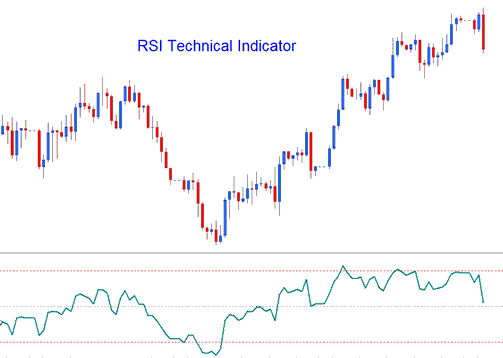
- RSI is drawn as a green line
- Horizontal dashed lines are plotted to spotting overbought & oversold levels are i.e. 70/30 levels respectively.
Stocks Trading Analysis & Generating Trading Signals
There are several techniques used to trade, these are:
50-level Crossover Signals
- Buy signal - when the indicator crosses above 50 a buy/bullish signal is given.
- Sell Stock Signal - when the indicator crosses below the 50 a sell/bearish signal is given.
RSI Stock Chart Patterns
Traders can draw stock trend lines & map out stocks chart patterns on the RSI indicator. The RSI often forms stocks patterns such as head and shoulders stocks pattern which might not have formed clearly on the stock trading price chart.
Stocks Trading Support/Resistance Break outs
RSI is a leading indicator & can be used to predict Support/Resistance Breakouts before stocks price breaks its support/resistance level. RSI uses the swing failure signal to predict when stocks price is about to break support and resistance areas.
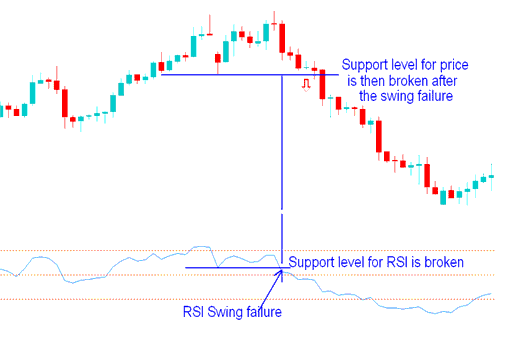
Swing Failure - Support & Resistance Breakout
Overbought/Oversold Conditions on Indicator
- Overbought- levels above 80
- Oversold- levels below 20
These levels can be used to generate stock trading signals such as when RSI turns up from below 20 after oversold, buy & sell when RSI crosses to below 80 after overbought, sell. These signals are not suitable for trading Stock because they are prone to a lot of whipsaws.
Divergence Stocks Trading Setups
Divergence trading is one of the technical analysis method used to trade reversals of the stocks price trends. There are four types of divergences that can be traded with this indicator covered in the divergence tutorial on this website.


