Stochastic Oscillator Stock Analysis & Stochastic Oscillator Trading Signals
Developed by George C. Lane
The Stochastic Oscillator is a momentum indicator - it shows the relation between the current closing stocks price relative to the high & low range over a given number of n periods. The Oscillator uses a scale of 0-100 to draw its values.
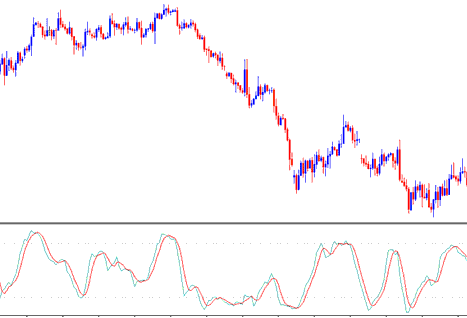
This Oscillator is based on the theory that in an up stock trend market the stocks price closes near the high of the stocks price range & in a downward trending market the stocks price will close near the low of the stocks price range.
The Stochastic Lines are drawn as 2 lines- %K & %D.
- Fast line %K is the main
- Slow line %D is the signal
3 Types of Stochastics Stocks Oscillators: Fast, Slow & Full Stochastics
There are Three types are: fast, slow and full Stochastic. Three indicators look at a given chart period for example the 14-day period, and measures how the stocks price of today's close compares to the high/low range of the time period that is being used to calculate the stochastic.
This oscillator works on the principle that:
- In an upward stock trend, stocks price tends to close at the high of the candlestick.
- In a downwards stock trend, stocks price tends to close at the low of the candlestick.
This stock indicator shows the momentum of the Stock trends, and identifies the times when a market is overbought or oversold.
Stocks Trading Analysis & Generating Trading Signals
The most common techniques used for technical analysis of Stochastic Oscillators to generate stock signals are cross overs signals, divergence trading signals and over bought oversold areas. The following are the techniques used for generating trade signals
Stock Trading Crossover Trading Signals
Buy signal - % K line crosses above %D line (both lines moving up)
Sell signal - %K line crosses below %D line (both lines moving down)
50-level Crossover:
Buy signal - when stochastic lines cross above 50 a buy stock trade signal is generated.
Sell signal - when stochastic lines cross below 50 a sell stock trade signal is generated.
Divergence Stocks Trading
Stochastic is also used to look for divergences between this indicator & the stock trading price.
This is used to determine potential stock trend reversal stock trade signals.
Upward/rising stock trend reversal- identified by a classic bearish divergence
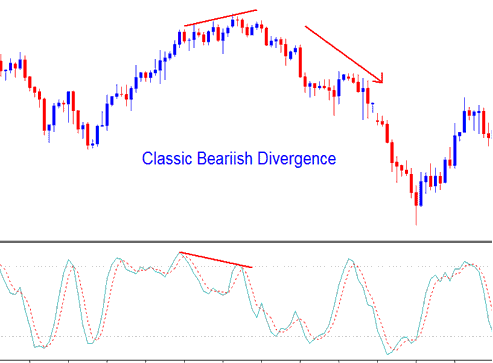
Stock Trend reversal - identified by a classic bearish divergence
Downwards/descending stock trend reversal- identified by a classic bullish divergence
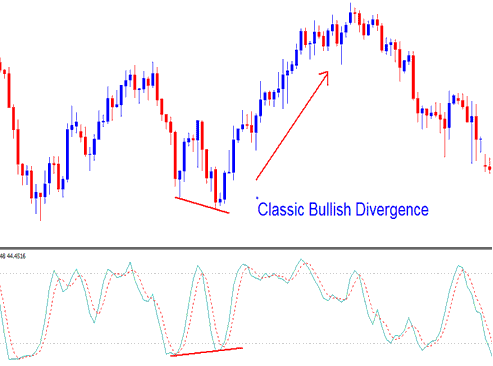
Stock Trend reversal - identified by a classic bullish divergence
Overbought/Oversold Levels on Technical Indicator
Stochastic is mainly used to identify potential overbought & oversold conditions in stock trading price movements.
- Over-bought values greater than 70 level - A sell stock signal occurs when the oscillator rises above 70% and then falls below this level.
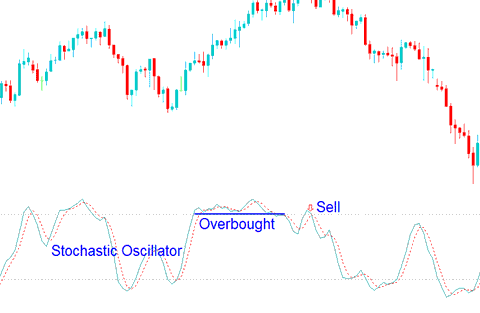
Overbought - Values Greater 70
- Oversold values less than 30 level - a buy stock signal is generated when the oscillator goes below 30% and then rises above this level.
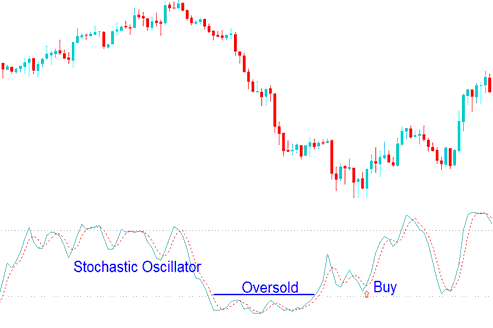
Oversold - Values Less Than 30
Trades are generated when Stochastic Oscillator crosses these levels. However, overbought/oversold levels are prone to whipsaws especially when the stock market is trending upward or downwards.


